Monthly S&P500 Emini futures candlestick chart:
Breakout is losing momentum
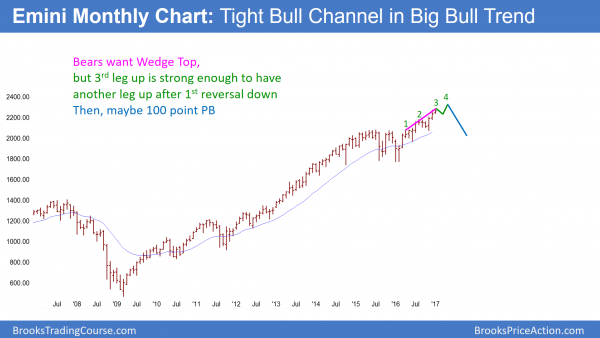
The monthly S&P500 Emini futures candlestick chart has a small bull doji bar so far this month. December was also small and had a tail on top. Therefore, the 3 month breakout is losing momentum.
The monthly S&P500 Emini futures candlestick chart is in a bull trend. Yet, the 12 month rally lacks consecutive big bull trend bars. It therefore looks like a bull leg in what will become a trading range. While there is no top yet, and the rally can continue indefinitely, this loss of momentum increases the chances for a pullback.
In addition, there is a gap below this month’s low and the top of the August trading range. When gaps form late in bull trends, they usually close. Hence, the odds of a big rally from here are small. While the Emini might reach a new high this month, the odds are that it would soon reverse down to close the gap. Since the August high is about 100 points below, the pullback will probably be about 5%. In addition, it probably will begin in February or March.
Weekly S&P500 Emini futures candlestick chart:
Weak bull flag after buy climax
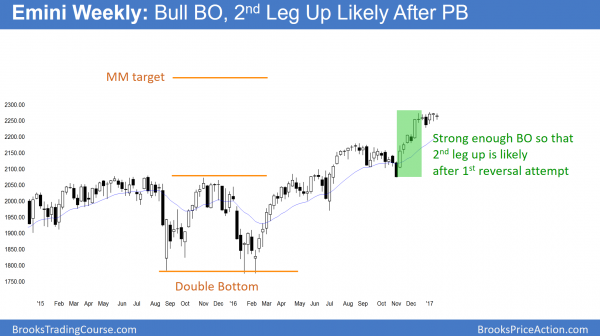
The weekly S&P500 Emini futures candlestick chart formed consecutive inside bars over the past 2 weeks. In addition, both were dojis. Furthermore, they are part of a 6 bar tight trading range. Hence, the weekly chart is in breakout mode.
The weekly S&P500 Emini futures candlestick chart has been in a 6 week tight trading range after a strong bull breakout. The bull breakout in December was a big bull trend bar. It was therefore a buy climax. When a buy climax comes late in a bull trend, it is more likely an exhaustion gap than a measuring gap. Hence, the odds favor a closure of the gap between this week’s low and the August high.
Low 4 and Consecutive Tops?
The rally that began in November was strong. Therefore, even if the Emini closes the gap above the August high, the odds still favor one more leg up. Hence, bulls will buy the selloff. Yet, if there is a pullback and then one more leg up, the bears will look for a Low 4 sell signal.
The 1st 2 tops were the June and August highs. The bulls then broke strongly up. If this 6 week tight trading range is a 3rd top, then one more new high would be a fourth. That would create a Low 4 sell setup.
It would also be consecutive complex tops. This means that there were two legs up to a top attempt in August. Instead, there was a bull breakout above the top. If that breakout gets 2 legs up and the Emini tries to top again, that would therefore be a 2nd complex top. Hence, there would be a pair of consecutive top attempts. Because each would have had 2 legs, each is complex. Consecutive complex tops have a 60% chance of leading to a couple of legs down.
Daily S&P500 Emini futures candlestick chart:
President Trump and January Effect stock market rally
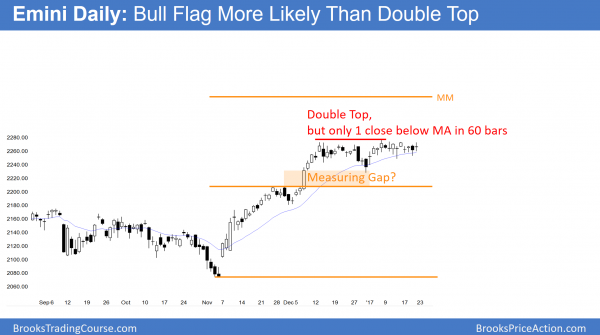
The daily S&P500 Emini futures candlestick chart is in a tight trading range. There is a double top with the December 13 high. In addition, there is a double bottom bull flag with the January 12 low.
The daily S&P500 Emini futures candlestick chart has a bull flag. Furthermore, only one day in the past 60 has closed below the daily moving average. Hence, the probability is slightly higher for the bulls, despite the neutrality of the tight trading range.
Dow 20,000 Big Round Number and psychological barrier
The Dow is within about 1% of 20,000. It is a psychological target. While there is no doubt that the Dow will get there, no one knows when. As long as the Dow is staying close, the odds are that the bulls will break above 20,000 soon. If it instead drops 5% to close the gap above the August high, it would then probably rally to above 20,000 within a few months.
Traders can see the end of the day bar-by-bar price action report by signing up for free at BrooksPriceAction.com. I talk about the detailed Emini price action real-time throughout the day in the BrooksPriceAction.com trading room. We offer a 2 day free trial.
When I mention time, it is USA Pacific Standard Time (the Emini day session opens at 6:30 am PST, and closes at 1:15 pm PST). You can read background information on the intraday market reports on the Intraday Market Update page.


