Market Overview: Nifty 50 Futures
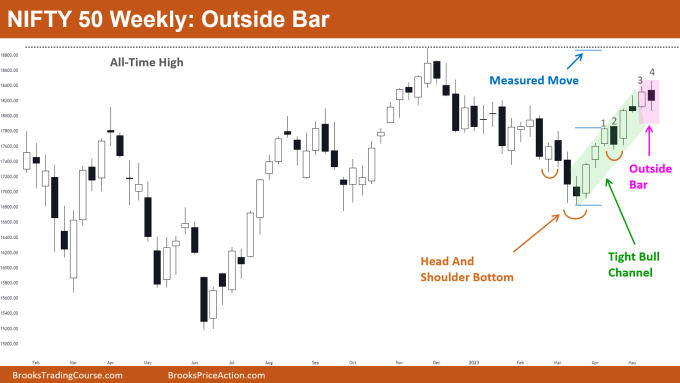
Nifty 50 outside bar on weekly chart where the market created a bear doji bear this past week. It is currently trading inside a tight bull channel. Measured move of the head and shoulder bottom and the all-time high could be acting like a magnet for the price.
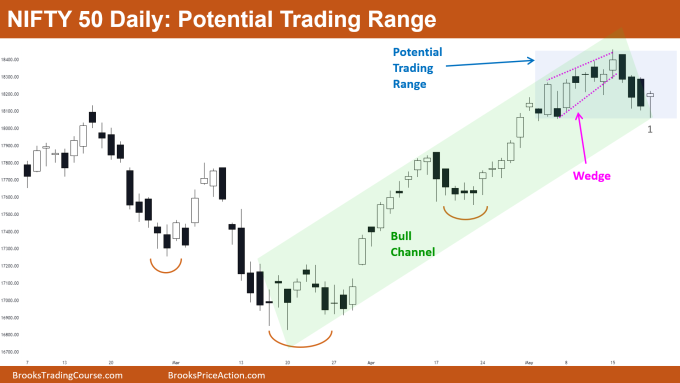
The daily chart of the Nifty 50 showed a bear breakout of a small wedge top, which may result in a small trading range for a few bars in the following week.
Nifty 50 futures
The Weekly Nifty 50 chart

- General Discussion
- Bears should hold off on taking any sell positions until they see strong bear bars because the market is trading inside of a tight bull channel and the bars on the left are powerful bull bars.
- Bulls should buy since the market is in a strong uptrend and because the all-time high price and measured move level could act as a magnet.
- Bulls can go long by placing a stop order at the high of the outside bar or a buy limit order at the low.
- Deeper into the price action
- Take note that only twice in the past 10 bars—on bars 2 and 4—have bears been able to push the market below its prior bar’s low.
- Bulls immediately bought the last time this occurred (i.e., on bar 2), and as a result, bar 2 was followed by a powerful bull leg.
- Bar 4’s lower tail suggests that many bulls had placed buy limit orders at bar 3’s low. Bulls who bought at bar 3’s low will (must) carefully monitor the following bar.
- If bulls are successful in obtaining a bull close, they will keep their position; but, if bears are successful in obtaining a bear close, this may disappoint bulls and cause a brief bear leg before a leg up to the all-time high level.
- Patterns
- The market gave a strong bull breakout of the head and shoulders bottom.
- Because the bull channel is tight, bears should refrain from selling using stop orders.
- Because the market is in a strong bull channel, bulls can buy using limit and stop orders.
The Daily Nifty 50 chart

- General Discussion
- The market displayed a bear breakout of a little wedge top, and by reaching the bottom of the top, it has already accomplished its goal.
- Channel and wedge breakouts typically result in a small trading range, thus bulls may choose to buy at the top of bar 1.
- Bears shouldn’t sell close to the bull channel’s bottom. Bears in the market should now wait for a bear breakout or for the price to return to the high of bull channel before selling.
- Deeper into price action
- After a long period of time, the market on the daily chart produced strong repeated bear bars, which may have encouraged some bears to sell the market.
- On the chart above, the wedge top, three successive bear bars, and increasing tails are indicators of a likely trading range.
- Traders must alter their approaches to trading when the market’s price activity changes.
- Similar to the situation described above, the market was in a strong bull leg before the bear breakout of the wedge top, but it is currently exhibiting trading range price action.
- This indicates that traders should re-evaluate their trading strategy and be prepared to exit early around the top of the trading range if necessary, as the market phase has moved from a bull trend to a small trading range.
- Patterns
- The market is trading inside a strong bull channel.
- A bearish breakout of the wedge top may result in a small trading range, suggesting that the market could form trading range bars (bars with small bodies and tails) during the coming week.
- Bulls holding long positions should re-evaluate the price action and be prepared to sell if the bears initiate yet another powerful bear leg.
Market analysis reports archive
You can access all weekend reports on the Market Analysis page.

