Market Overview: Nifty 50 Futures
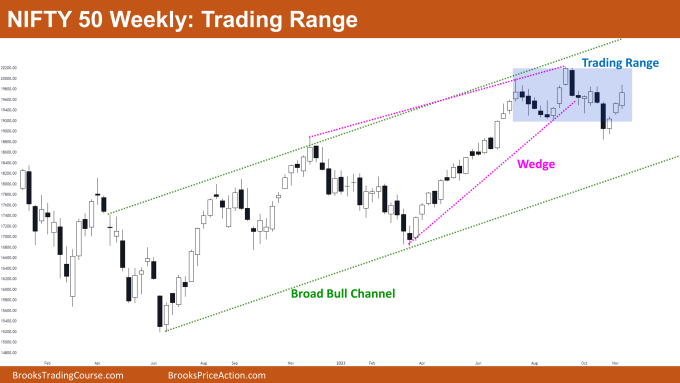
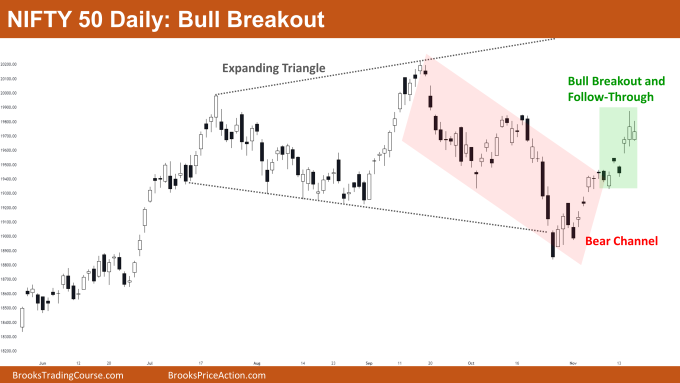
Nifty 50 Trading Range on the weekly chart. The market on the weekly chart gave a weak bull close (due to the tail at the top) this week. After a failed bear breakout attempt that received no follow-through, the market has once again entered the trading range. Bears have also attempted a bear breakout of the wedge top, but they have not been successful in getting strong follow-through bars. On the weekly chart, the Nifty 50 has been moving for a while inside a broad bull channel. As a result, traders should concentrate on purchasing low and selling close to the channel’s high. On the daily chart, the Nifty 50 demonstrated a robust bull breakout from the bear channel. The market continues to trade within the large, expanding triangle pattern.
Nifty 50 futures
The Weekly Nifty 50 chart

- General Discussion
- Both bulls and bears will have trouble structuring a profitable trade because the market is moving within a small trading range.
- Because the trading range is short in height, limit orders—that is, placing a buy limit order at a bar’s low near the bottom of the trading range and a sell limit order at a bar’s high near the top should be preferred by both bulls and bears when entering positions rather than stop orders.
- Deeper into the price action
- Although the market produced a bear breakout of the wedge top, the bears were unable to produce a second leg down. The likelihood that the market would have reached the bottom of the wedge would have been high if the bears had been able to get a follow-through down.
- Patterns
- Because the market is moving within a trading range, traders should expect a measured move from the breakout if bulls are able to get a bull breakout of the range.
- Since there is a 50/50 chance of a successful breakout on either side of a trading range, traders should aim for a risk to reward ratio of at least 1:2 in order to achieve a positive traders equation.
The Daily Nifty 50 chart

- General Discussion
- A buy position can be taken on a high-1 or high-2 bar in anticipation of the market’s successful bull breakout of the bear channel.
- Since the market is currently in a strong bear leg, bears should hold off on taking short positions.
- Bulls buying on a high-1 or high-2 should be exiting their trade around the @20100 level.
- Deeper into price action
- Notice that the market has formed big moves up and big moves down on the left, so chances are high that the market would soon convert into a trading range.
- For this reason, bulls who are purchasing at current levels need to sell their positions close to the @20100 level.
- Patterns
- The market is trading inside an expanding triangle pattern.
- Nifty 50 has given a bull breakout of the bear channel so chances of a big trading range (spanning the height of the bear channel) are high.
Market analysis reports archive
You can access all weekend reports on the Market Analysis page.

