Market Overview: Nifty 50 Futures
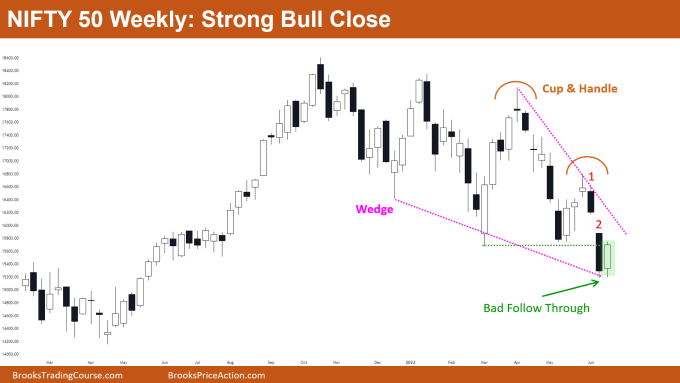
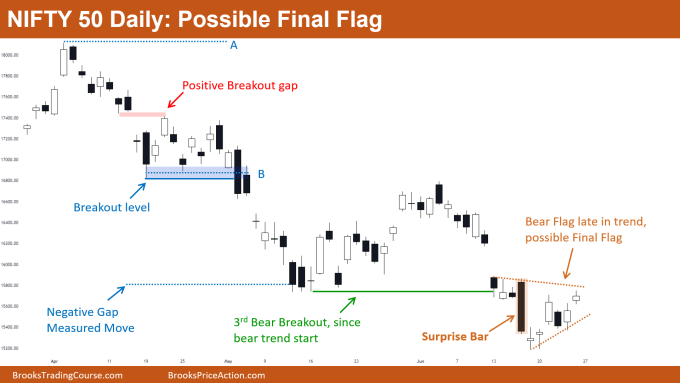
Nifty 50 strong bull close on futures weekly chart, near wedge bottom line, and possible failed bear breakout of a cup & handle pattern. On the daily chart, Nifty 50 forming possible final flag, so the least bulls can expect is a trading range on both weekly and daily charts.
Nifty 50 futures
The Weekly Nifty 50 chart

- General Discussion
- Weekly chart gave a strong bull bar closing near high, enough to convince bears to exit out of their shorts, so possible move up expected in the coming week.
- Bulls would prefer to buy on High 2 rather on High 1, as that would increase the probability.
- Deeper into the price action
- If you look carefully, the open of this week was above the close of last week. This means even after 2 consecutive bear bars, the bears bought back their shorts and booked their profits – showing they are less confident.
- To convince many bulls, the market has to form one more bull bar closing near high. But if the next bar is not a strong bull bar, or a bear bar, then you have to expect one more leg down and then enter long on a good High 2 buy signal bar.
- Patterns
- Market forming wedge bottom near start of bull trend (as you can see from the bars on left). This increases the chances of market going higher.
- As bears who shorted cup & handle are also trapped, many bears would be covering their positions. Bulls would be buying, thus increasing the chance that market is going higher.
- Pro Tip
- Whenever you get strong leg down, like bar 1 and 2 marked in chart, then you have to expect one more leg down.
- That is because bears who shorted on close of bar 2 know they are now trapped, so they would be scaling in higher and would try to exit at their average sell price (ie, at breakeven)
The Daily Nifty 50 chart

- General Discussion
- Market gave another bear breakout (green level) but bad follow-through, also forming a bear flag which can be possible final flag.
- This bear breakout would be the 3rd bear breakout (look at red, blue, green levels) thus possible reversal expected.
- Increasing bull closes and increasing bad follow-through to bear bars suggest that market can soon convert into trading range.
- Deeper into price action
- Whenever you get a surprise bar (marked in chart), then there is a 60% chance you would at least get one more leg down, from where bulls and bears decide where to go further.
- Notice each bear breakout, there is a constant increasing in depth of pullbacks suggesting decreasing bearishness in the market, with probably a trading range soon.
- Market likes to give Measured Moves based upon breakout gaps, like the above highlighted in the chart.
- Every time you see a breakout you can expect a move down equal to the distance between start of the trend and middle of the gap (A ➠ B according to above chart).
- Patterns
- Whenever you get a triangle or trading range with sell climax, bad follow-through bars, with increasing tails late in trend, then this has higher chance of being the final flag rather than a continuation pattern.
- The surprise bar turned out to be a sell climax late in trend. We also got bad follow-through after the bear breakout of 3rd breakout level (green line). This increases the chances of a reversal rather than bear trend.
Market analysis reports archive
You can access all weekend reports on the Market Analysis page.

