Market Overview: Nifty 50 Futures
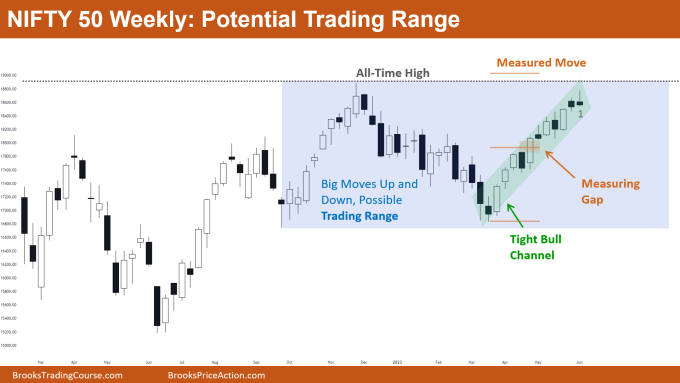
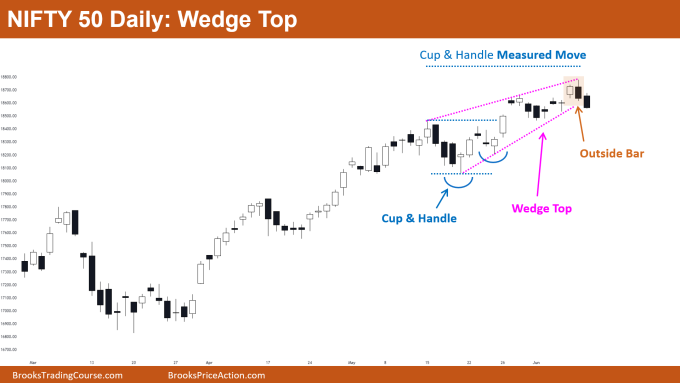
Nifty 50 Potential Trading Range on the weekly chart. This week, the market established a small bear bar. Since the bar is closing near to its low and has a long tail above it, some bears will look to sell at the low of the bar in anticipation of a probable reversal. Most bears would refrain from selling on this small bear bar because the Nifty 50 is still trading within the tight bull channel on the weekly chart. On the daily chart, the Nifty 50 is developing a wedge top; the market has already given a bear breakout of this wedge top.
Nifty 50 futures
The Weekly Nifty 50 chart

- General Discussion
- Since the market is trading inside of a tight bull channel, the majority of bears would wait to sell until the market forms another strong bear bar.
- Bulls should not buy (even with limit orders) because the market is currently trading close to the top of its possible trading range.
- Deeper into the price action
- Pay close attention to the bars on the left, especially the ones in the blue box. You’ll see that the market developed sharp bull and bear legs.
- The likelihood that a market will transition into a trading range is extremely high whenever it exhibits this type of behaviour, especially after a trending phase.
- Because the body of the bear bar is so small, very few bears would think about selling at the low of bar 1 (the sell signal bar).
- Therefore, traders typically wait for the market to form a large bear bar before selling, but note that this comes with the cost of a larger stop loss.
- Patterns
- Market has a measuring gap measured move target that is pending.
- A large number of bulls would hold the long to pursue the measured move target.
- If the following bar is a strong bear bar, the bulls who are still holding their positions will be trapped and will try to get out, which will cause the market to fall even more.
- If the bears are successful in forming a strong bear leg from this level, the market would confirm the big trading range.
The Daily Nifty 50 chart

- General Discussion
- The market is in a strong bull trend on the daily chart, but a wedge top would encourage more bears to sell in anticipation of a major trend reversal.
- With two consecutive bear bars closing near their lows, the market showed a bear breakout of the wedge top.
- If the market forms another bear bar, the bulls who are waiting for the cup and handle measured move target are likely trapped and will exit their trades.
- Deeper into price action
- The outside bar was a strong bear bar, and a subsequent powerful bear bar (breakout bar) followed. Bears require a follow-through after a breakout to be successful.
- At the breakout bar’s low, many bears would be selling, and the bears who want high probability shot would wait to sell until the follow-through bar.
- Patterns
- Because reversal patterns have a low chance of success, bears selling need to have a good risk-to-reward ratio, ideally 1:2 or 1:3.
- Bears would wait for another bear bar and then sell at its low if they wanted to engage in a high-probability trade. This would raise the stop-loss while also raising the likelihood of success.
Market analysis reports archive
You can access all weekend reports on the Market Analysis page.

