Market Overview: Nifty 50 Futures
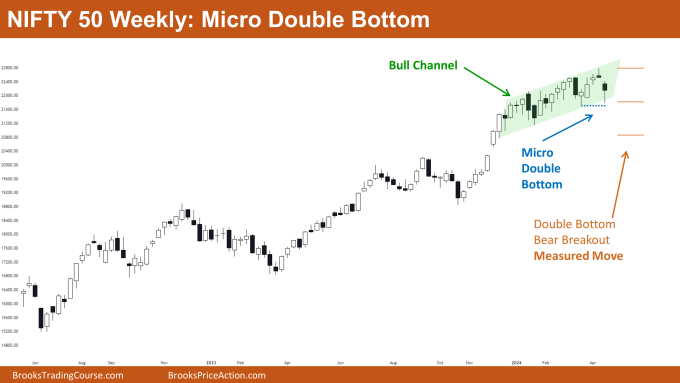
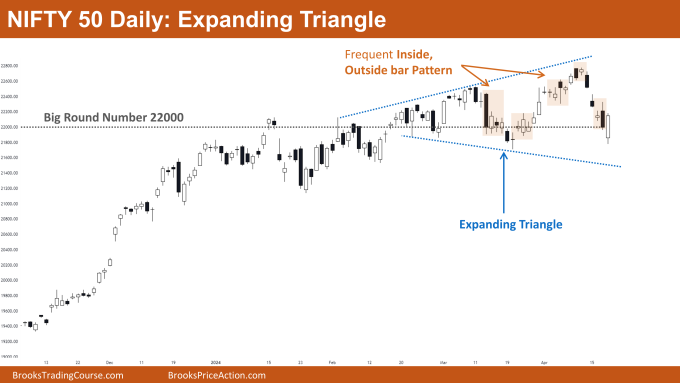
Nifty 50 Micro Double Bottom on the weekly chart. This week, the market closed with a weak bearish tone. The candle shows a small bearish body with a long tail at the bottom. This weak close reduces the likelihood of a significant trend reversal. Instead, the bears might see a trading range rather than a full reversal. The market has also formed a micro double bottom, and if there’s a bearish breakout from this pattern, it could push the market towards a price around 21,000, which would serve as strong support. On the daily chart, Nifty 50 is trading within a large expanding triangle pattern. Currently, it’s in a bearish leg approaching the bottom of this expanding triangle. With the market trading near the significant round number of 22,000, traders should anticipate trading range price action in the upcoming trading week.
Nifty 50 futures
The Weekly Nifty 50 chart

- General Discussion
- Bulls who are currently holding long positions should continue holding them as the market hasn’t shown strong signs of a major trend reversal.
- The market is trading near the bottom of the bull channel and is forming a micro double bottom. Thus, bears should refrain from selling near these levels.
- Traders who haven’t yet entered this strong bull trend can consider entering when the market achieves a strong bull close above the high of this week’s bar or above the all-time high.
- Deeper into Price Action
- Over the past several weeks, the market has formed more bull bars than bear bars. However, it’s worth noting that these bull bars have small bodies and tails.
- This could indicate an upcoming trading range. If the bears manage a bear breakout of the micro double bottom, the likelihood of a trading range would increase.
- The expected trading range height in that scenario would be equivalent to the height of the bull channel the market is currently trading within.
- Patterns
- The market is trading inside a tight bull channel, making it challenging for bears to profit. In such a bull channel, bears should always wait for a bear breakout.
- The market has formed a micro double bottom near the bottom trendline of the bull channel. If bulls achieve a bull breakout above the neckline, the market could experience a measured move upward.
The Daily Nifty 50 chart

- General Discussion
- As the market is currently trading near the bottom of the expanding triangle, bulls can start taking long positions. Bears, on the other hand, should not be shorting the market.
- Bears who already shorted at the top of the expanding triangle and are still holding a short position can start to exit their position.
- Since the previous bear leg was strong, the chances of a 2nd leg down are high. Therefore, both the bulls and bears will have an opportunity to buy and sell, respectively, at a better price.
- Deeper into Price Action
- Nifty 50 is currently trading near the significant level of 22000. Traders should treat the market like a trading range, meaning they should buy low, sell high, and take quick exits.
- Whenever the market makes a strong move in one direction, the chances of a 2nd leg are high. For instance, if the market forms a strong bull leg in a bull trend, the chances of a 2nd leg up before a reversal are very high.
- It’s essential to note that the above pattern is not valid when the market is trading in a trading range. The probability that the market would form a 2nd leg is higher in trending phases and decreases if the market is in a trading range phase.
- Patterns
- The market has been forming a lot of inside bars and outside bars on the daily chart. Whenever inside/outside bars occur too frequently, this is a sign of a trading range phase.
Market analysis reports archive
You can access all weekend reports on the Market Analysis page.

