Market Overview: Nifty 50 Futures
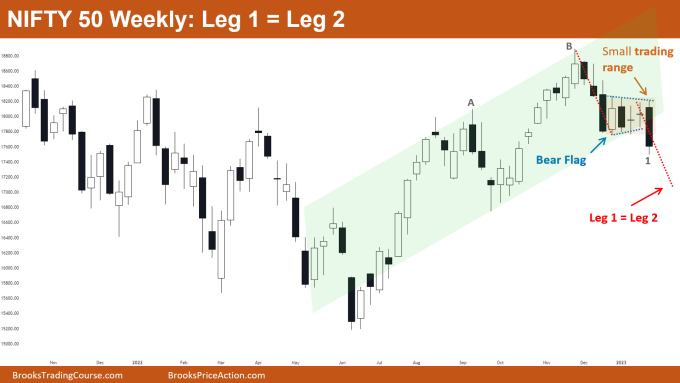
Nifty 50 leg 1 = leg 2 measured move on the weekly chart after giving a bear breakout of the smaller triangle. The market also broke below the strong bull channel, and now bears need a follow-through bar for a successful bear breakout of the bull channel.
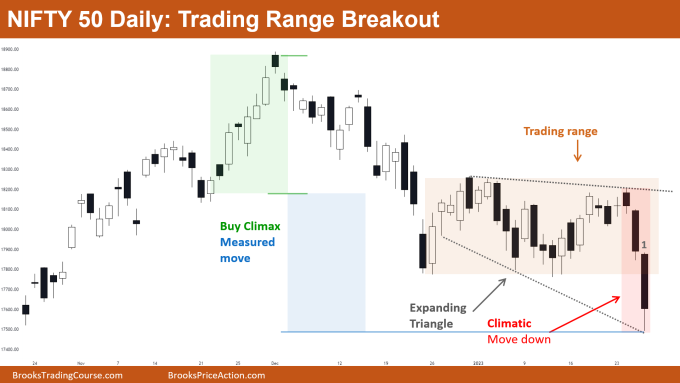
Nifty 50 on the daily chart is forming an expanding triangle and also gave a bear breakout of the trading range with a climatic bear leg. This implies that there are higher chances of going sideways for the next few bars below continuing down (on the daily chart).
Nifty 50 futures
The Weekly Nifty 50 chart

- General Discussion
- The market was in a strong bull trend (and a bull channel) but this week’s bar gave a close below the bottom of the bull channel.
- Bulls would be waiting until they see some consecutive bull bars.
- Bears would be selling below the low of the breakout bar and would be targeting the measured move down of leg 1 = leg 2.
- Deeper into the price action
- Till the previous week, market was trading in a small trading range for nearly a month, this week’s market gave a bear breakout with a big bear bar.
- The range of the bear breakout is twice the range of the last 4 bars and occurring after a tight trading range in a bull trend, and is a surprise for both bulls and bears.
- Whenever the market forms a surprise bar (or a surprise move) then the chances of moving one more leg in the same direction are higher.
- Patterns
- The market broke below the strong bull channel with a strong bear bar closing near its low.
- The market also gave a bear breakout of the bear flag, so this would attract some more bears to sell for the measured move down.
- After this strong bear breakout the best bulls can get is a trading range and not a resumption of the bull trend.
- Pro Tip: Has the bull trend ended?
- How can you conclude whether a bull trend has ended or not? Follow the below steps.
- Has the market recently formed a strong bear leg?
- A strong bear flag is a sign of a strong reversal attempt by the bears, so chances of reversal improve with the strength of the bear leg.
- Did the reversal attempt get any follow-through?
- It is important to note that reversal bears should get good follow-through.
- Case 1: Leg A (marked in the chart) was a strong reversal attempt but did not receive any follow-through. Instead, bulls resumed the trend by forming strong consecutive bull bars.
- Case 2: Leg B (marked in the chart) is a strong bear leg and bulls were not able to resume the trend up. Now bears are getting follow-through (Bar 1) which increases the chances of Trading Range and Reversal.
The Daily Nifty 50 chart

- General Discussion
- The market on the daily chart formed an expanding triangle where the last leg was a climatic bear leg.
- Many bears would avoid selling for the trading range breakout below the bear breakout bar, as they would have to take a huge risk (big stop) relative to the probability that trading range breakouts give.
- Bulls would not be buying after this climatic bear leg as they know that the chances of a small 2nd leg sideways to down are higher rather than a bull leg.
- Deeper into price action
- Bar 1 has a long tail at the bottom and the market is trading near the bottom of the expanding triangle, so bears would avoid selling near these levels. Rather, they would prefer selling only after the market forms a small bull leg – as this would decrease their risk (stop size).
- Bulls would not buy until the market again enters the trading range.
- Patterns
- The market finally reached the measured move target of the buy climax, and the tail (of bar 1) implies that bears took some profits.
- If the bears start selling again below the low of bar 1, then this would mean that bears are targeting the trading range measured to move down.
- The market has also formed an expanding triangle, so if the market starts forming bull bars, then bears would focus on selling again near the top of the expanding triangle.
Market analysis reports archive
You can access all weekend reports on the Market Analysis page.

