Market Overview: Nifty 50 Futures
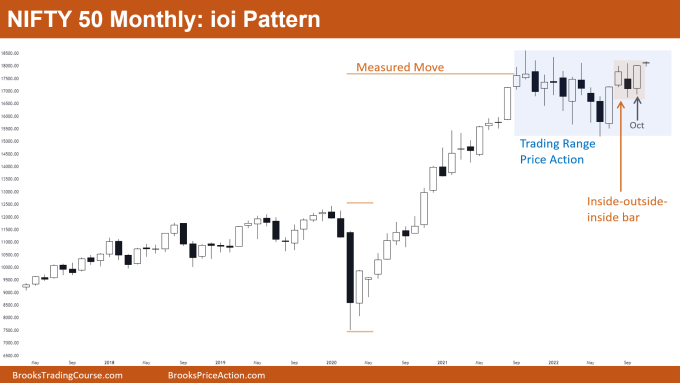
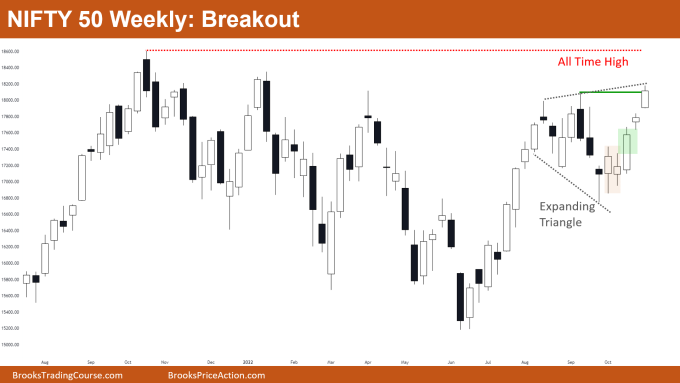
Nifty 50 futures ioi pattern (inside-outside-inside bar) formed on the monthly chart. The market gave a strong bull close but is currently near the trading range top, so traders would wait for a good follow-through bar (or breakout) before taking any position. The Nifty 50 on the weekly chart gave a breakout of a swing high.
Nifty 50 futures
The Monthly Nifty 50 chart

- General Discussion
- Nifty 50 still has too much trading range price action due to many bulls resisting to buy near the all-time high.
- Bears were not able to form a strong consecutive bear bar since the market made an all-time high. This means chances of reversal are much less.
- Any bull buying should be placing their stop below the trading range low and swing their position.
- Bears should sell for scalp when they see strong consecutive bear bars on the next lower time frame (weekly chart). But they have to exit once the market reaches the trading range bottom (buy low, sell high and scalp).
- Deeper into the price action
- If you look at the bars to the left you would notice that bars have many tails above and below, as well as bull bars being followed by bear bars.
- Bad follow-through bars and tails above and below bars are a hallmark of a trading range so you trade it like a trading range.
- The market is in a strong bull trend and bears are not able to show much strength so buying anywhere (with a wide stop) would be reasonable (but be careful when you are selling).
- Patterns
- The market reached the measured move target and bulls started taking profits but bears are not shorting due to market going sideways (trading range).
- Nifty 50 is forming an inside-outside-inside bar with a breakout too. Now traders would be buying on the next bar if they get good follow through.
- Pro Tip
- Nifty 50 was in a big bull trend after the pandemic and has now converted into a trading range. The trading range consists of less than 20 bars.
- When the market forms a trading range in a bull trend, and the trading range consists of less than 20 bars, then there is a high probability that the market would successfully breakout to the upside.
- As the number of bars increases in the trading range, the probability of a successful breakout comes close to 50-50.
The Weekly Nifty 50 chart

- General Discussion
- Nifty 50 on the weekly chart has a breakout of a swing high, but the breakout bar is not very strong.
- Bulls would be interested to buy only if they get good follow-through. Some bulls would hesitate to buy as the market is near an all-time high.
- There is a breakout gap (green box) which formed after the market gave a successful breakout of the inside bar (this is a sign of strength for the bulls).
- Deeper into price action
- This bull leg is very strong (it has 5 consecutive bull bars) which means there is a high probability of a 2nd leg up
- The breakout of the swing high is not that strong because the breakout bar has a tail above.
- Fewer bulls would be willing to buy near the all-time high also, because the breakout bar is not that strong.
- Bears have no reason to sell until they get strong consecutive bear bars. If bears do not get any reason to sell, then there is a high probability that bulls would make a new all-time high.
- Patterns
- Currently, the market is near the top of an expanding triangle, so bears would look to short on a strong bear bar.
- Bulls wait for a good follow-through bar to buy this swing high breakout.
- Some bulls would be buying this breakout and would swing their position with a wide stop (stop probably at bottom of expanding triangle).
Market analysis reports archive
You can access all weekend reports on the Market Analysis page.

