Market Overview: Nifty 50 Futures
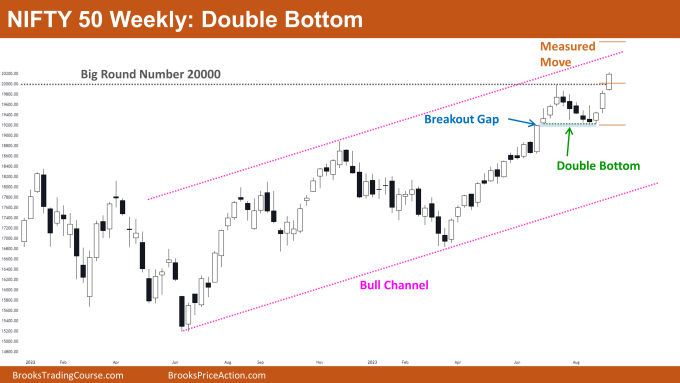
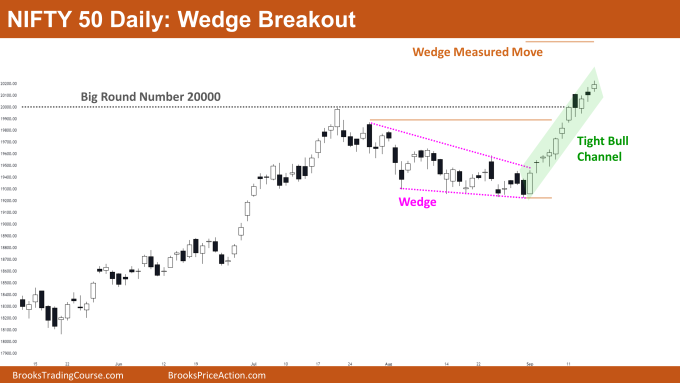
Nifty 50 Double Bottom on the weekly chart. On the weekly chart, the market is currently trading inside a large bull channel. This week, the market formed a strong bull close that resulted in a breakout of the important round number 20000. Bulls were able to obtain a breakout gap, which may result in a measured move up. On the daily chart, the Nifty 50 is trading inside a tight bull channel. Bulls prevailed over the bears and achieved a strong bull breakout of the wedge, which may then result in a measured move up depending on the wedge’s height.
Nifty 50 futures
The Weekly Nifty 50 chart

- General Discussion
- The market produced three strong bull bars in a row, suggesting that there is a greater likelihood of another leg up before any sort of reversal.
- Bears should hold off selling the market and wait until it reaches the bull channel’s measured move or top trendline.
- Bulls can purchase at the high of the strong breakout bar and hold their long positions until the market reaches the measured move target.
- Deeper into the price action
- The bears have failed to form strong consecutive bear bars over the past few bars, which clearly demonstrates that the likelihood of a reversal is low.
- Bulls were able to get a breakout gap, which might lead to a measured move up.
- The bull breakout is extremely strong for the reasons listed below.
- In all three bars, the bar’s open is higher than the previous bar’s close. This shows that bulls are buying the closes.
- There are hardly any bodies that overlap. As you can see in the most recent bear leg, the bear bars’ overlapping bodies are a sign of weakness, in contrast to the bull breakout’s lack of overlapping bull bodies.
- A sign of strength is fewer tails on the bar.
- Patterns
- The market has also demonstrated a breakout of the double bottom pattern, which has resulted in a measured move up.
- Bulls can buy at the high of a bull bar, and if the next bar is a big, strong bear bar (bad follow-through for the bulls), then bulls may want to consider selling their long positions, or they may choose to wait until the market forms a second leg up and sell at breakeven.
The Daily Nifty 50 chart

- General Discussion
- The market is trading inside of a tight, strong bull channel. Using limit orders, bulls can buy close to the bull channel’s lower trendline.
- No significant bear bars have formed in the previous ten bars, so bears should refrain from selling.
- Deeper into price action
- There are numerous bull gaps in the narrow bull channel, which indicates the bulls’ strength. Bull gaps typically result in a measured move with a measuring gap.
- Bulls need strong follow-through bars for this breakout to be successful. The likelihood of this breakout succeeding will be reduced if bears can create two or three bars of strong bear bars.
- Three consecutive closes above the big round number 20000 show that the bulls are strong enough to maintain the price above 20000 and the bears are weak to drive prices lower.
- Patterns
- Market has given a strong breakout of the wedge which will lead to a measured move up based on the height of the wedge (shown using brown line).
Market analysis reports archive
You can access all weekend reports on the Market Analysis page.

