Market Overview: Nifty 50 Futures
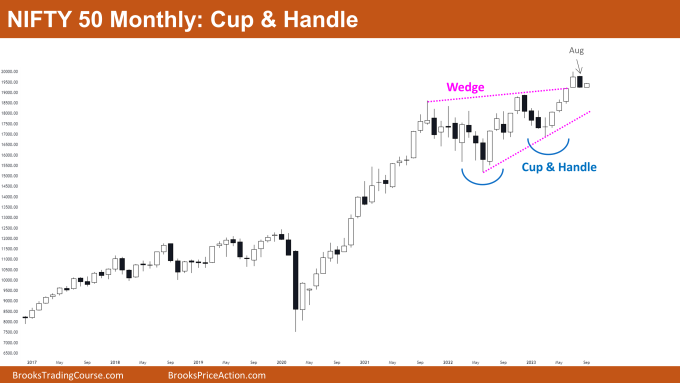
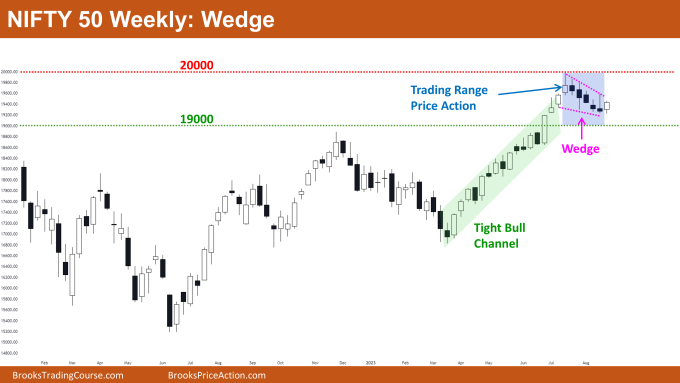
Nifty 50 Cup & Handle on the monthly chart. On the monthly chart, the market showed a bull breakout of the cup and handle pattern in the month of July, but since the market did not produce a strong follow-through bar this month, the likelihood of a failed bull breakout may have increased. On the weekly chart, the market is trading within a small wedge, and if this wedge breaks out, a trading range may result. The bears’ attempt at a reversal was insufficient to bring about a reversal.
Nifty 50 futures
The Monthly Nifty 50 chart

- General Discussion
- Bears can sell for the wedge top’s unsuccessful breakout attempt with a small stop-loss at the high of the July month bar.
- Since this is a low probability sell trade, traders must prepare to take a target that is at least two times the risk.
- As a result of the market’s poor follow-through bar following the bull breakout, bulls shouldn’t buy. Bulls have the option of placing buy stop orders at the July month bar’s high.
- Deeper into the price action
- Even after the strong bull leg, bears were able to produce a strong bear close, which may have encouraged more bears to sell the market in anticipation of a failed breakout attempt.
- Patterns
- After a bull trend, the market is currently trading inside a wedge top.
- Since there is only a 25% chance that a bull breakout from a wedge top will be successful, bulls should always keep a favourable risk-to-reward ratio in mind.
- Bulls failed to provide a strong follow-through bar after the market gave a strong bull breakout of the cup and handle pattern.
The Weekly Nifty 50 chart

- General Discussion
- Bulls and bears should both use the buy low, sell high trading strategy as the market is forming a trading range.
- Because the trading range on the weekly chart is too small to trade, some traders may choose to wait until the market breaks out of the range, while others may switch to a chart with a lower time frame to trade the trading range.
- Chances of a second leg up increase when the reversal attempt is feeble, as in the case of the chart above. Bulls may therefore open a buy position on either a high-1 or high-2 entry.
- Deeper into price action
- The market has begun to form candles with smaller bodies and long tails above and below in the last 5–10 bars. This might be an indicator to a future trading range.
- Bears must make a strong attempt to reverse this bull trend because of how strong the tight bull channel is.
- The bears made a feeble attempt at a reversal over the previous five bars; the best they can get is a trading range rather than a reversal.
- Patterns
- Because the bull trend is so strong, the bears must make a strong attempt to turn the market around.
- The levels of 19000 and 20000 are acting as the bottom and top of the trading range, respectively.
Market analysis reports archive
You can access all weekend reports on the Market Analysis page.

