Market Overview: Nifty 50 Futures
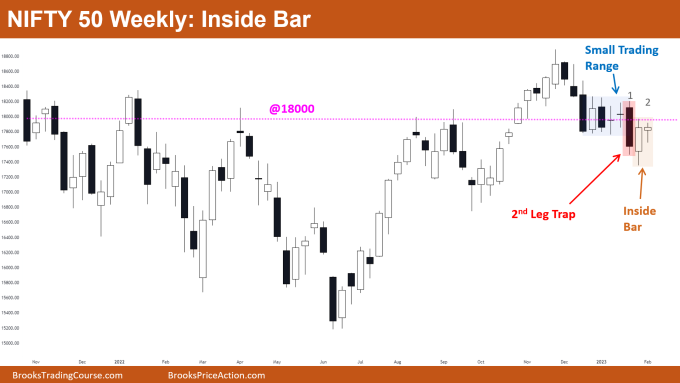
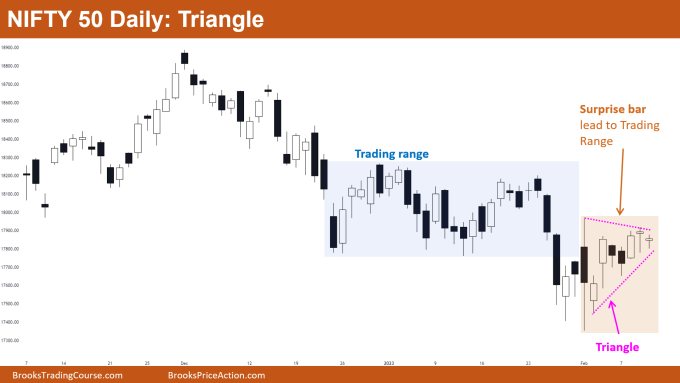
Nifty 50 bull inside bar on the weekly chart, with market forming a small bull bar this week indicating that there would be a trading range in the shorter time frame. The market is currently trading close to the big round number 18000 from the previous few weeks. On the daily chart, the market formed a triangle, indicating that it is in a breakout mode. However, the best that bulls and bears can hope for is a trading range.
Nifty 50 futures
The Weekly Nifty 50 chart

- General Discussion
- It is not a good time for bears to sell for the second leg down because the last two bars were bull bars that closed near their highs.
- Some bulls can buy above the high of bar 2 (depicted in the above image), believing that bar 1 was a bear trap.
- Even if bulls buy above bar 2, they would not be expecting a trend resumption up as the bear leg down (from an all-time high) is strong.
- Bulls would not anticipate a trend resumption up even if they buy above the high of bar 2, as the bear leg down (from the all-time high) is strong.
- Deeper into the price action
- The likelihood that the market would once again trade at the low of bar 1 is high if enough bears sold below that level (i.e., low of bar 1).
- The bears who sold below bar 1 would quickly exit their positions if the market once more forms a bull bar closing near its high because they would then realize they are trapped.
- Patterns
- The market is near the big round number 18000 which acts like a magnet for the price.
- If the market forms another bull bar closing near its high then one can expect a 2nd leg up.
The Daily Nifty 50 chart

- General Discussion
- The market has been trading in a sideways price action since it formed a big surprise bar with tails above and below.
- There is a triangle pattern developing in the market right now which makes it harder for both bulls and bears to place any trade on either side.
- There is a trading range above the triangle pattern, so even if bulls can get a bull breakout there are higher chances of the market trading inside the trading range (blue box).
- Deeper into price action
- Surprise bars usually lead to a trend reversal or a trend resumption but here the market formed a surprise bar with long tails above and below.
- Whenever the surprise bar is of this type, then one can expect trading range price action rather than a trend.
- Bulls can expect a potential reversal up if they are successful in breaking out of the triangle pattern. This would indicate that the trading range (blue) was the final flag in this bear trend.
- Patterns
- The daily chart currently shows two trading ranges, indicating that the market is in a trading range phase.
- Traders would anticipate a measured move up of the triangle pattern, and a surprise bar, if the market successfully breaks above the triangle pattern.
Market analysis reports archive
You can access all weekend reports on the Market Analysis page.

