Market Overview: Nifty 50 Futures
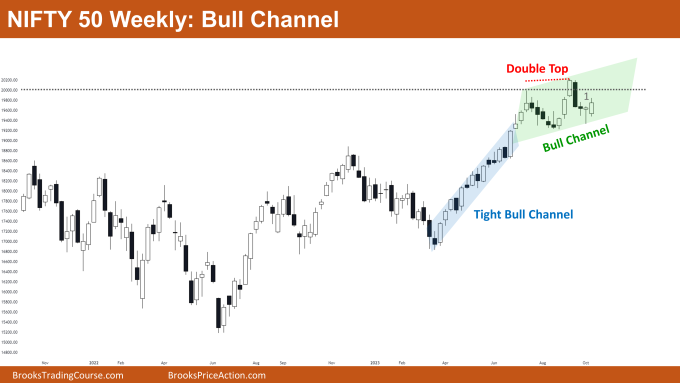
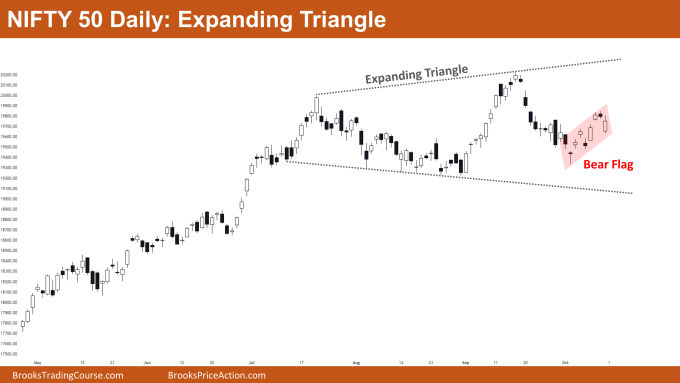
Nifty 50 Bull Channel on the weekly chart. The market is currently trading close to the bottom of the bull channel after forming a bull bar with a short tail at the top. After the double top reversal attempt, the bears were unable to change the trend. A bear reversal is less likely because there haven’t been any strong bearish bars in a row. On the daily chart, the Nifty 50 is trading inside of an expanding triangle. After a strong bear leg, the market is also forming a bull channel, suggesting that this bull channel may actually be a bear flag.
Nifty 50 futures
The Weekly Nifty 50 chart

- General Discussion
- Because the market is exhibiting trading range price action, traders should buy near the channel’s low and sell near its high.
- Trading range price action should be anticipated for the upcoming weeks as the market is currently trading close to the big round number 20000.
- Deeper into the price action
- The market has been forming bars whose bodies overlap those of the bars on the left, which is an obvious indication of trading range price action.
- The market did not form a strong bull bar this week, and many bulls would have purchased using stop orders at the high of Bar-1 (represented in the graph).
- Therefore, if bears were successful in forcing a bear close, these bulls would be disappointed and would cut their losses. This could cause the bull channel to break down on the downside.
- Patterns
- The likelihood of a reversal is decreased because the market has formed a tight bull channel to the left.
- Bears made feeble attempts to reverse the trend. Now the best they can get is a trading range.
The Daily Nifty 50 chart

- General Discussion
- The market is trading inside of a bear flag; on a strong bear breakout, bears can scalp for a quick profit.
- Traders have two options for buying: they can wait for the bear breakout of the bear flag to fail, or they can buy if the bears fail to cause any breakout at all and the market resumes its bull leg.
- Deeper into price action
- The market formed two small bear bars and three relatively strong bull bars this week.
- Bulls have had success delivering strong bull closes even after the strong bear leg; this may be a sign that the market is about to turn upward.
- Since the market is currently trading close to the significant round number 20,000, traders should anticipate range-bound price action.
- Patterns
- Because the market is currently in the middle of a large expanding triangle, the likelihood that the next leg will be upward or downward is almost 50% (much like when the market is in the middle of a trading range).
- Traders can anticipate the market to reach the bottom of the expanding triangle if bears are successful in obtaining a bear breakout of the bear flag.
Market analysis reports archive
You can access all weekend reports on the Market Analysis page.

