Market Overview: Nifty 50 Futures
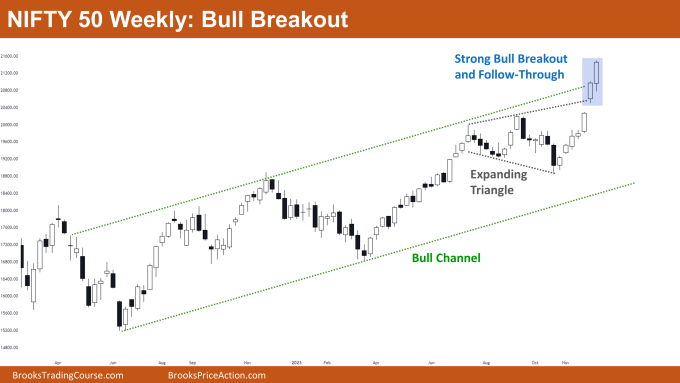
Nifty 50 Bull Breakout on the weekly chart. On the weekly chart, the Nifty 50 produced yet another strong bull close. The market is currently creating seven straight bull bars, which makes it more difficult for bears to enter the market. The bull channel has seen a robust bull breakout in the market. Until bears are able to form strong consecutive bear bars, there is very little chance of a reversal with these strong consecutive bull bars. Strong bull breakouts from narrow bull channels have been seen on the Nifty 50, and bulls are also capable of strong follow-throughs. Some bulls may decide to hold onto their positions until the market reaches the bear channel breakout market target, as the market is currently trading very close to it.
Nifty 50 futures
The Weekly Nifty 50 chart

- General Discussion
- The market has been forming strong bull bars for the past seven weeks, and before any type of reversal, it may rise for at least one more leg.
- Until they receive bear bars that are just as strong, bears shouldn’t be selling the market.
- Bulls may enter the market at a bull close, a bull bar high, or, if they want to be more cautious, by waiting for a pullback.
- Deeper into the price action
- The market has been forming strong bull bars for the past 10 to 20 bars, and the majority of them are closing close to their highs.
- This indicates a robust bull trend. Bulls should keep buying (or holding) until weak bull bars or bear bars begin to form on the market.
- Patterns
- The market produced a robust bull breakout within the bull channel. Typically, there is only a 25% chance of a bull channel successfully breaking out.
- The expanding triangle has also seen a bull breakout in the market, and depending on how high the pattern is, this could signal a measured move higher.
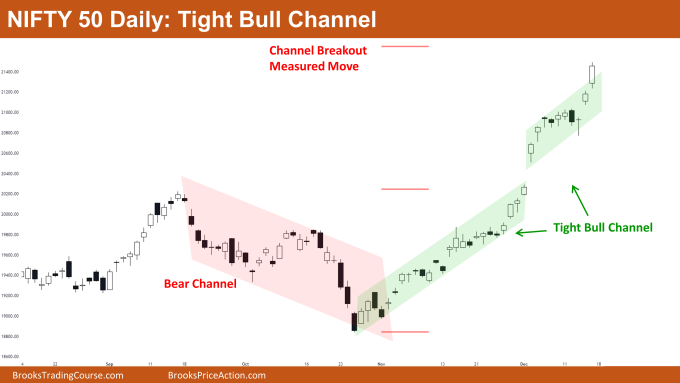
The Daily Nifty 50 chart

- General Discussion
- The market is getting closer to the measured move target after making a bull breakout of the tight bull channel.
- If the market begins to form a trading range in price action, bears may wait until the market reaches the measured move and then try to sell close to that level.
- Traders can decide whether to enter a trade or hold a long position by waiting until the market reaches the measured move target.
- Deeper into price action
- The market has been creating significant gap ups, and its ability to hold and advance upward indicates a strong bull trend.
- The inability of bears to form strong, consecutive bear bars over the past few bars suggests that there is very little chance of a reversal.
- Patterns
- As seen in the above chart, the market has produced a bull breakout from the bear channel. The market typically provides a measured move target upward based on the height of the bear channel when a breakout of the channel occurs.
- The market has produced bull breakouts from the tight bull channels, which will also result in a gradual increase in value depending on the tight bull channel’s height.
Market analysis reports archive
You can access all weekend reports on the Market Analysis page.

