Market Overview: Nifty 50 Futures
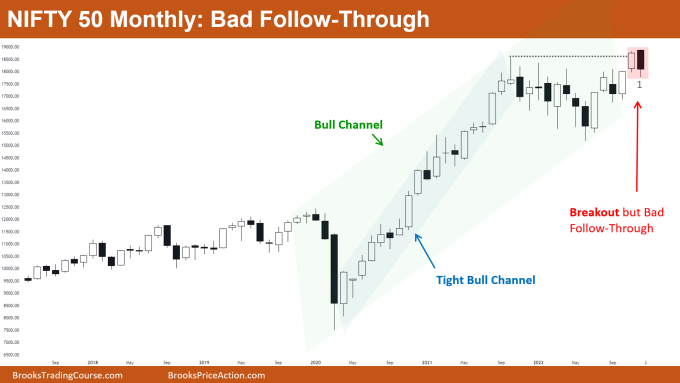
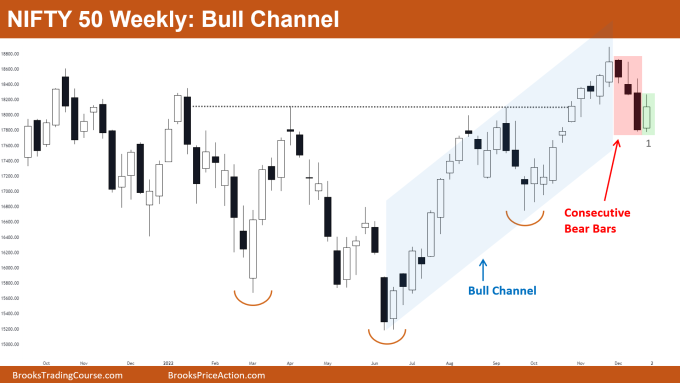
Nifty 50 bad follow-through after a breakout attempt of the all-time high level. Market on the monthly chart is currently in a trading range phase as many tails up and down are seen in the last few bars, so traders can expect a few more bars of sideways price action. The market on the weekly chart is in a bull channel, and bears got a bad follow-through bar (green box) after 3 consecutive bear bars which indicates possible sideways price action for the next few bars.
Nifty 50 futures
The Monthly Nifty 50 chart

- General Discussion
- The market gave a bad follow-through bar after breakout above the all-time high level, so this decreases the number of bulls buying above bar 1 (marked in the chart above).
- The market is still in a bull trend and near the bottom of the bull channel so many bears would avoid selling below bar 1.
- Seeing the price action of bars on the left (tails above and below bars, bad follow-through bars…) suggests that the market can show more sideways price action. Some traders prefer to wait and not take any new positions.
- Deeper into the price action
- As the overall trend is strong and the market has not been able to form strong and consecutive bear bars, bears would prefer to enter shorts by limit orders rather than market or stop orders.
- Many bears would see a shorting opportunity as the market gave bad follow-through after the breakout. As the market is in a bull trend, bears place their sell limit orders above bar 1 rather than shorting below bar 1 with a stop order.
- Patterns
- The market is following the market cycle
Breakout phase (no pullbacks)
Tight bull channel (small pullbacks)
- Bull channel (intermediate pullbacks)
- Broad Bull Channel (deep pullbacks)
- Trading Range
- The market is following the market cycle
- Pro Tip: Deciding Type Of Orders To Place Based On Different Market Phases
- Breakout Phase: As there are no pullbacks in this phase, one should focus on entering the market with market orders or stop orders only as you would miss the trend if trying to enter with a limit order.
- Tight Bull and Bull Channel Phase: Because the trend is strong and the market also has small pullbacks, traders can enter the market both with limit orders or stop orders. Aggressive traders would prefer stop order entry and conservative traders would prefer limit order entry – both are reasonable things to do.
- Broad Bull Channel and Trading Range Phase: As pullbacks are deep you should be focusing on selling with stop orders below strong bear bars (near trading range top) or selling with limit orders above weak bull bars (near trading range top) and vice versa for trading range bottoms.
The Weekly Nifty 50 chart

- General Discussion
- The market is near the bottom of the bull channel so bulls would be buying above strong bull bars and bears would avoid selling near this level.
- As the market made a strong bear leg after giving a breakout above the all-time high level, this increases the chances of at least a small 2nd leg down.
- As the bear leg was strong many bear scalpers would try selling above the high of 1 with a limit order and expect a small 2nd leg down.
- Deeper into price action
- The bull channel (blue color) is strong and this bear leg is the strongest reversal attempt by bears since the channel started.
- This definitely would attract more bears, but we also know that market is in a bull trend which creates confusion and leads to trading range price action.
- Patterns
- Bulls who bought the breakout of the cup & handle bottom are now trapped and would try to exit their positions near the recent top.
- Consecutive bear bars followed by a bull bar above the midpoint create confusion for both bulls and bears.
- The market is in a bull channel but the most recent bear leg is very strong which increases the chances of the market converting into a broad bull channel.
Market analysis reports archive
You can access all weekend reports on the Market Analysis page.

