Market Overview: NASDAQ 100 Emini Futures
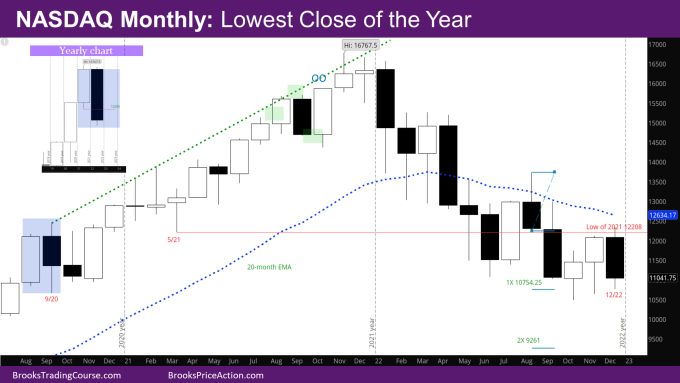
The December monthly NASDAQ Emini futures candlestick is a bear trend bar with small tails above and below. It is the lowest monthly close of the year.
The bulls needed a good follow-through bar this month to the bull bars in the past two months, but they could not get it. There were bull targets above – the low of 2021 at 12208 and the monthly exponential moving average (EMA) around 12720. It was more likely for the year to end somewhere in between those two targets (given last year was a strong bull bar), but the bears have managed to close the year near its low.
Since the year closed near the low, it’s more likely for the market to go below the low to see where buyers come in. If bulls can get a good signal bar in the next month or two, they can try for double bottom with October and a reversal.
NASDAQ 100 Emini futures
The Monthly NASDAQ chart

- This month’s candlestick is a bear trend bar with small tails above and below.
- As mentioned last month, after triggering the October buy signal bar in November, the question was how far high before sellers come in – likely near the monthly EMA.
- The bears came in earlier, around the low of 2021 – 12208.
- The bear targets mentioned last month are back in play.
- Possible bear targets –
- The August monthly bar was a credible Low 1 Sell Signal bar. Assuming a 40% chance of success, a 2X target based on size of the August bar would be at 9261. The market has already made the 1X target.
- The August monthly bar as a double top (DT) bear flag with May high, with the neckline around July low, and a measured move (MM) down would be between 9000-9200.
- If January can be a bear bar closing on its low, these targets become realistic.
- It’s more likely that January will be a trading range bar with a tail below.
- Possible bull targets –
- Monthly EMA around 12630.
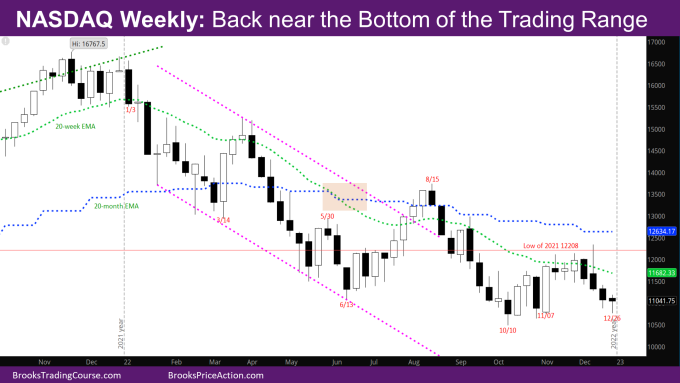
The Weekly NASDAQ chart

- This week’s candlestick is a bear doji bar with a big tail below.
- As mentioned a couple of weeks back, there was likely more selling to around the open/low of the week of 11/7 and buyers around the low of 11/7.
- The market reached the low of the bar of 11/7 this week and bounced but also likely another small leg down in the next few weeks.
- The market is back near the bottom of the trading range from the past two months. If the market goes below the October low, there will likely be buyers.
- As mentioned before, bulls will need a good signal bar around the bar from the week of 10/10. The market is down around that level. Can the bulls create a good bull buy signal bar in the next few weeks?
Market analysis reports archive
You can access all weekend reports on the Market Analysis page.

