Market Overview: NASDAQ 100 Emini Futures
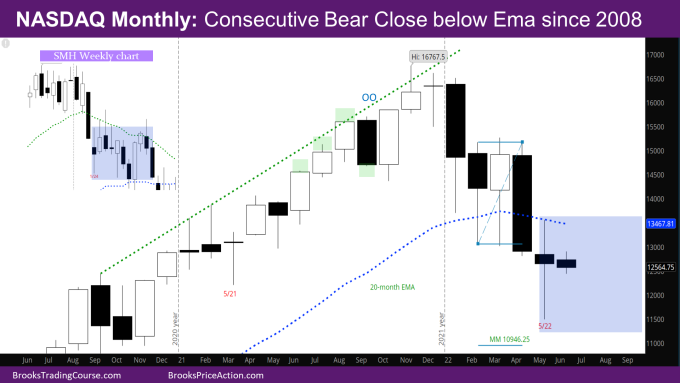
The NASDAQ Emini futures May monthly bar was a doji bear bar with close above midpoint, a big tail above and below, and close below exponential moving average (EMA). It is the first time with a consecutive monthly bear close below EMA since 2008 crash.
For an idea of what could happen over the next few months on the monthly chart, look at the weekly chart of SMH (inset). The May month on the NQ looks like the week of 1/24 on the SMH weekly chart. The next few months of the NQ could then look like the weeks that followed 1/24 on the SMH chart. It will create a Low 1 likely below the EMA, which would then retest the lows before deciding what to do next.
NASDAQ 100 Emini futures
The Monthly NASDAQ chart

- The May monthly bar is a doji High 2 reversal bar with a bear body below the EMA, with big tails on top and the bottom.
- This can be considered a failed bear breakout of the EMA. At the same time, two bear bars closed below the EMA, and tails indicate likely sellers above and buyers below and sideways to down for the next several months.
- Since the market closed above the middle of the bar, and it’s a reversal bar, it’s slightly more likely that the market first tests the high to see where sellers come in.
- If the market tries testing the high, bull upside targets that are interesting for this month–
- Monthly EMA at 13467
- High of the May month at 13555.25 (essentially at the monthly EMA)
- The next target for the bears would be the measured move (MM) down of the double bottom (DB) on monthly chart at 10946.25, or the open of the November 2020 month at 11139.5. November 2020 is when the spike on monthly chart started after the sideways months of September and October. At this point, it is still likely these targets will be met in the next few months.
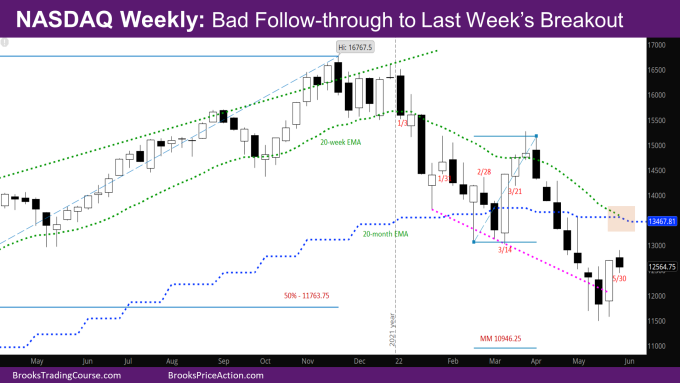
The Weekly NASDAQ chart

- This week’s NQ candlestick is a bear bar near last week’s high with a tail on top and the bottom.
- It is a bad follow through to last week’s big bull bar and hence is more likely to lead to sideways to lower in the next few weeks.
- Couple of problems for the bulls in the past couple of months have been –
- lack of good signal bars – the signal bars are bear bars, which increases the chances that the market will come back and test them. The signal bar 2 weeks ago were OO bear bars, and market is trying to break above them.
- single big bull bars, as opposed to smaller consecutive bull bars – Usually big bars lead to exhaustion and attract sellers.
- The Weekly EMA is almost touching the monthly EMA – The last time the weekly EMA crossed below the monthly EMA was during the 2008 financial crisis.
Market analysis reports archive
You can access all weekend reports on the Market Analysis page.

