Market Overview: NASDAQ 100 Emini Futures
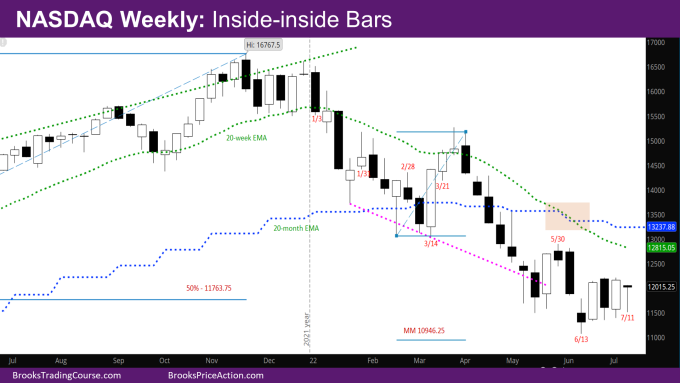
NASDAQ 100 tight trading range (TTR) for the last 4 weeks. Last week’s report had made a case for price going higher in the next few weeks, and for the market to go to the weekly exponential moving average (EMA). This is still valid.
NASDAQ 100 Emini futures
The Weekly NASDAQ chart

- This week’s Nasdaq Emini candlestick is an inside-inside (ii) doji bar with a big tail at the bottom. This means this week is inside last week’s bar, and last week is an inside bar to the bar two weeks ago.
- This is a breakout mode pattern, as is a TTR.
- The bulls are disappointed because they couldn’t breakout above the high of the TTR. The bears are disappointed because they couldn’t close the week at its low which would have been a good bear bar. The bulls have a slight edge above the bears because they closed this week as a doji bar.
- There is nothing much new to add to last week’s report – except that the weekly EMA, which is the target for the bulls, is now lower at 12815. Everything mentioned in last week’s report is still valid.
- Wrt the market reaching the weekly EMA, there are two ways to do it – the market can keep going sideways till the EMA catches up to it, or it can break above the TTR till it reaches the EMA.
- For the bears, the last swing high (where their stops likely are) at 12899.25 is higher than the weekly EMA currently at 12815. Bears would like the market to keep going sideways till the EMA catches up, so their stop does not get hit before more sellers that should come in at the EMA.
- The market is likely setting up a triangle on the weekly chart with the last swing high of 5/30, and last low of 6/13.
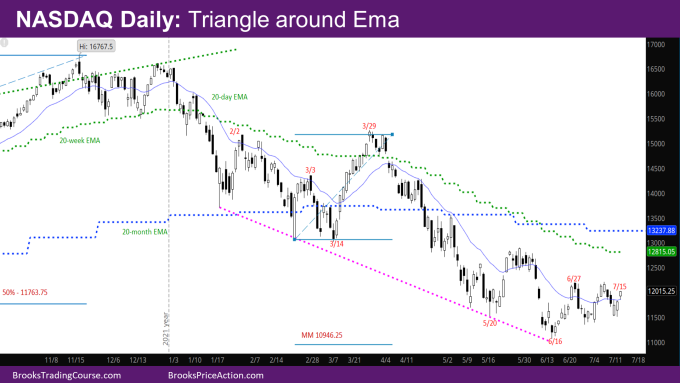
The Daily NASDAQ chart

- Friday’s NQ candlestick is a bull bar with a small tail at the bottom. The action earlier in the week took the market below the daily EMA, but Friday closed back above the daily EMA.
- The daily chart has been in a triangle for the past three weeks – the bulls are making higher lows, and the bears lower highs.
- The bulls have enough buying pressure in the last three weeks to support their case of the market breaking above the triangle.
Market analysis reports archive
You can access all weekend reports on the Market Analysis page.

