Market Overview: NASDAQ 100 Emini Futures
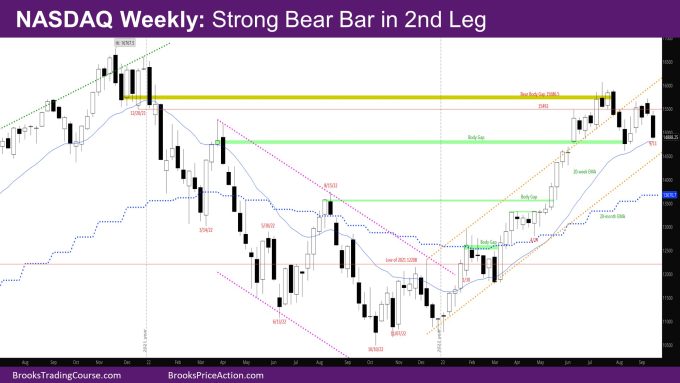
The NASDAQ Emini futures week is a strong bear trend bar closing on its low approaching support at the weekly exponential moving average (EMA). The second leg down from 7/31 is confirmed. In other words, the first move down was from 7/31, and now the 2nd leg is confirmed.
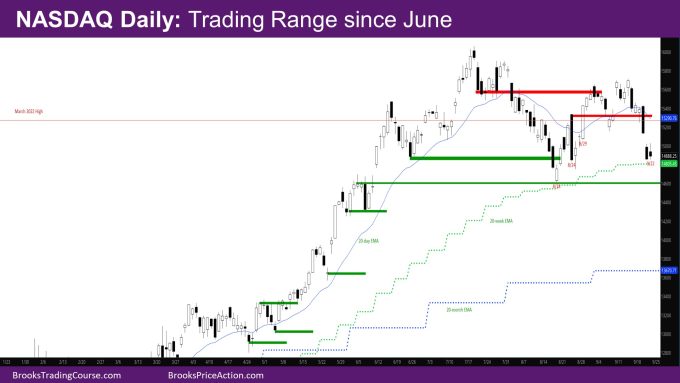
On the daily chart, this week is a strong second leg down with gaps. It is a correction expected from the wedge mentioned in last week’s report. Looking back, the daily chart looks like a trading range since June, with market approaching the low of that range.
Next week is the last trading week of the month and the quarter. The monthly bar so far is a strong bear bar. Bears want to close the month on its low, while bulls want a tail at the bottom just like last month. Bulls also want the close above the low of July – 15063.25, which is technically the sell signal bar (although a bad one since it’s a bull bar).
NASDAQ 100 Emini futures
The Weekly NASDAQ chart

- The week is a strong bear trend bar approaching the weekly EMA closing on its low.
- It is a breakout bar after the sell signal bar last week, indicating this is the 2nd leg down after the first leg down from 7/31.
- Now the bears need a follow-through bar to convince sellers of more down.
- This is less likely since the weekly EMA should act as support. This is the first time the market would be approaching the EMA since early March.
- At the same time, the 2nd leg is strong enough that there will likely be another leg down.
- We are back in the area of the bull gap from March 2022. Bears had a small overlap with it the week of 8/14.
- To effectively call the gap closed, bears need a couple of bear closes below that gap.
- If bulls can go up from here, the body gap close would be a considered a negative gap – a small overlap, but trend resumption up.
The Daily NASDAQ chart

- Friday is a doji bear bar overlapping Thursday.
- Last week’s report mentioned that the daily chart looked like a wedge bear flag (WBRF) – 3 pushes up, but with bad sell signal bars.
- This week the daily chart had a two-legged correction from that wedge.
- The second leg of this correction is especially strong breakout with follow-through, so it will likely have another leg down.
- Monday was a bull reversal bar just above the daily EMA and near the bottom of Friday which was a big bear bar.
- The market did not trigger the reversal bar Monday.
- Tuesday went lower and formed another bull reversal bar this time below the EMA.
- Wednesday triggered the Tuesday reversal bar but ended up as a big outside down day closing below Tuesday’s low by more than it went above Tuesday’s high.
- This was the start of the 2nd leg down.
- There was an opportunity here for a double bottom with 9/7, but Thursday gapped down far below Wednesday and 9/7.
- There were likely buyers below 8/28 which was a strong bull bar, who are now possibly trapped.
- The market should let them get out break-even or with a scalp profit.
- If the market goes as high as the low of the Wednesday outside down day, there should be sellers.
- All of this will likely result in another leg down.
- Bulls hope for a Wedge bull flag and a double bottom with 8/18.
- That would essentially make the market in a big trading range since June, and we would be at the bottom of the trading range.
Market analysis reports archive
You can access all weekend reports on the Market Analysis page.

