Market Overview: NASDAQ 100 Emini Futures
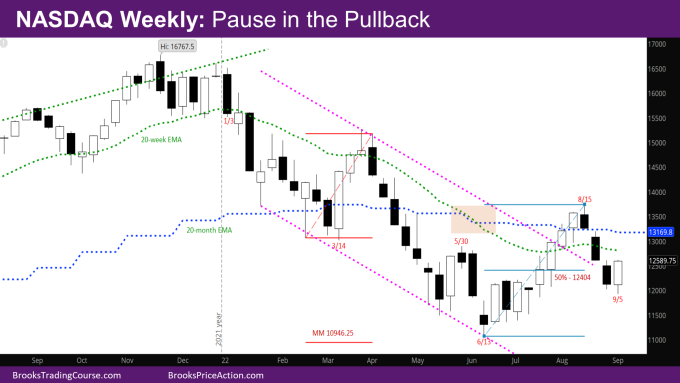
The NASDAQ Emini futures had a pause in pullback this week after two weeks of pullback.
The market had a strong move up from June, so there should be a second leg up after this pullback. At the same time, the pullback since August is strong enough that it should have its own second leg first.
NASDAQ 100 Emini futures
The Weekly NASDAQ chart

- This week’s Nasdaq Emini candlestick is a bull trend bar with a tail at the bottom.
- While the bull bar is strong, it closed right around the high of last week’s bear bar. It also went lower below last week’s low by more than it went above last week’s high. There should be sellers above this week to have a second leg down.
- If the bulls can manage to get another bull bar next week, proportional in size to this week, that would be more bullish. At that point, they would be back above the weekly and monthly EMAs. This is less likely.
- Last week’s report had mentioned that the market is–
- around a 50% pullback of the move up from June – So far buyers have come in.
- Is re-testing the bear trendline that it broke out above – It is bouncing off the trendline.
The Daily NASDAQ chart

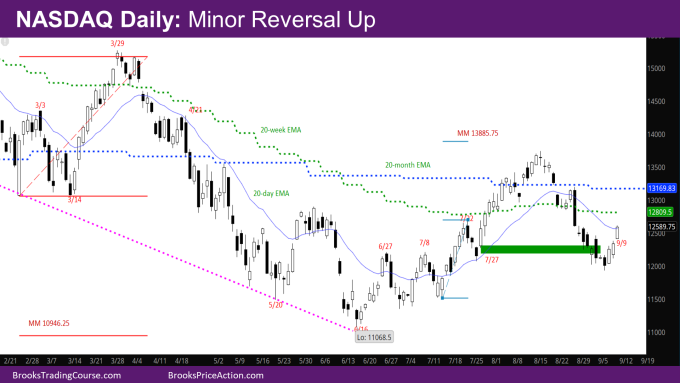
- Friday’s NQ candlestick is a big bull trend bar closing on its high.
- Friday bull close is just slightly above the EMA. As has been mentioned before, a big bull bar closing right around the EMA is likely to attract more sellers than buyers.
- This is likely a minor reversal up from the bear leg down in August.
- At the same time, the bull bars on Thursday and Friday are proportionally strong, so there should be a second leg up, even if for one bar.
- The market made the bottom of the bull channel that was drawn in green in the report two weeks ago.
Market analysis reports archive
You can access all weekend reports on the Market Analysis page.

