Market Overview: NASDAQ 100 Emini Futures
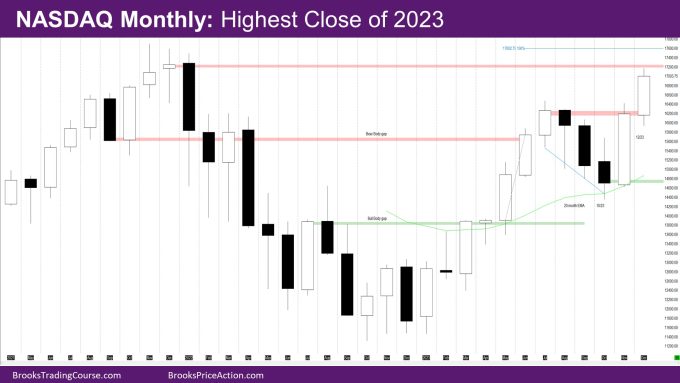
The Nasdaq Emini futures December monthly candlestick is a big bull trend bar with a small tail above and below. It is the highest monthly close of 2023 and a good follow-through bar to the November bull bar.
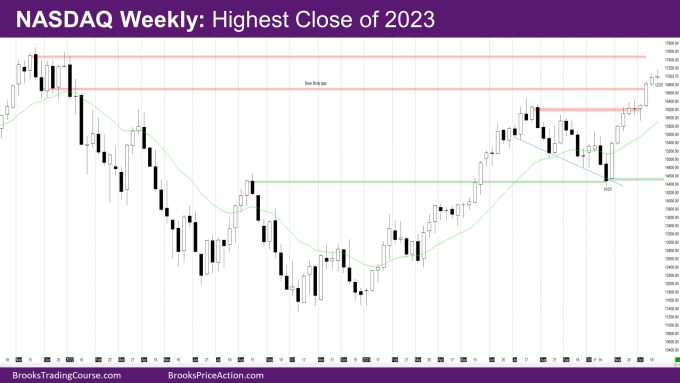
The week is a doji bull bar closing below the mid-point with a tail above.
On the yearly chart, 2023 is a big bull inside bar that has essentially reversed the bear bar of 2022. It is a H1 buy signal bar, but a bad buy signal bar given the size. Bulls need a good entry bar next year. The market should trigger the buy signal bar by going above it, possibly to a new ATH. Bulls will wait to buy a pullback – likely 50% of 2023 bar size, or 50% of 2022 bar size (which may have been a sell for limit order bears). This is around the October 2023 low, and prior reports have mentioned that this is likely a test area given the bear micro-channel of August-October.
So its more likely for next year to be a doji bar with tails above and below, closing with a small body for the year.
NASDAQ 100 Emini futures
The Monthly NASDAQ chart

- The December month bar is a bull trend bar and a good follow-through bar to November.
- It is the highest close of 2023.
- Bulls needed a good follow-through bar to November, and they got it.
- Bears likely sold the November close. They will sell the December close so that January is either a bear bar or an inside bar to prevent a 3-bar bull micro-channel November – January.
- If January is an inside bar, it could start the next leg up.
- Also mentioned in last month’s report, bulls could not prevent an extra monthly bear bar – October from being created which then resulted in a bear micro-channel August-October whereby the high of the month was lower than the high of the prior bar.
- So even if the bulls get a move higher, the market should test within the range of the October bar at some point in the future.
- The next target for the bulls is the high close of 2021 as well as the MM target of the bodies of the May and June bars (shown on the chart)
The Weekly NASDAQ chart

- The week is a smaller than average bull doji bar with a tail above.
- With the two bull bars in the 2nd and 3rd week of the month, the market had already reached the average size of a monthly bar, so it was not likely that the last week would be another good bull bar.
- The next target for the bulls is the high close of 2021.
- Bears want to close the breakout gaps to show that the market is transitioning into a trading range.
Market analysis reports archive
You can access all weekend reports on the Market Analysis page.

