Market Overview: NASDAQ 100 Emini Futures
The NASDAQ Emini futures market is in a trading range with bull leg pausing at the weekly exponential moving average (EMA). The question is how high will the bull leg be?
The January monthly bar so far is a good bull reversal bar. A couple of problems for bulls: It is an inside bar (i.e. high and low within the December bar). It has lot of overlap with the December month bear bar, and big in size to be a good reversal bar.
Given there is still 1.5 weeks left in the month, the month will end up an even bigger bar if bulls continue to buy. If it sells off, the month ends with a tail on top. Either way, the upside is likely limited to around the high of December or the monthly EMA, and the sideways move will have to continue till the bulls produce a better reversal bar on the monthly chart.
NASDAQ 100 Emini futures
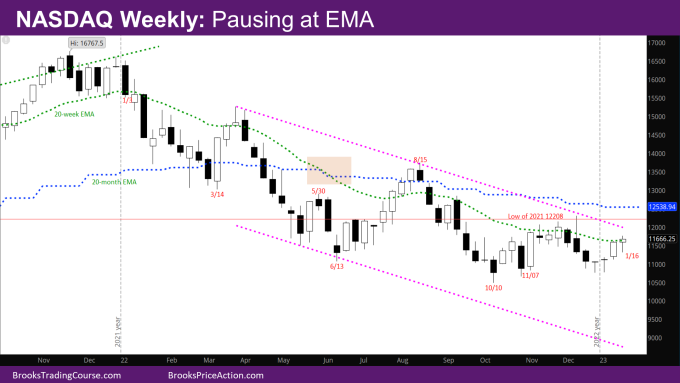
The Weekly NASDAQ chart

- This week’s candlestick is a trading range bar, a bull leg pausing at the weekly EMA – a bull bar with a small body, a small tail at the top and a long tail below.
- As was likely, the bears tried selling at the weekly EMA.
- The bulls reversed the selling to end the week with a close slightly above the weekly EMA.
- While this will likely lead to slightly higher prices, the tails above and below bars indicate trading range price action.
- The market will likely need to go more sideways to down and form a triangle.
- Bulls still need a good signal bar around the bar from the week of 10/10.
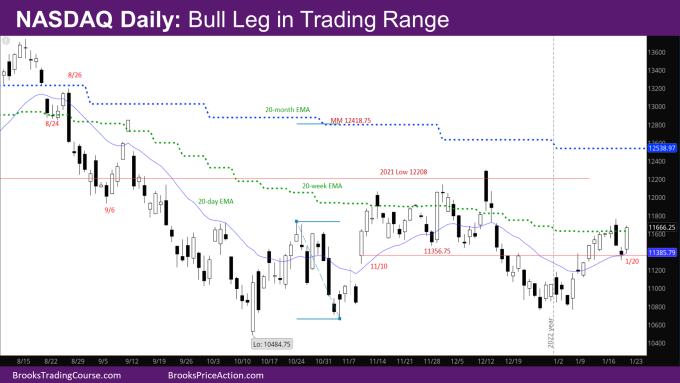
The Daily NASDAQ chart

- Friday’s NQ candlestick is a bull trend bar that spans the daily EMA on the lower side, and the weekly EMA on the higher side.
- As mentioned last week, the market could go sideways between the daily and weekly EMA till they are close enough, so the bulls can break above both the daily and weekly EMAs in the same week.
- This week did something like this – it went down strongly to the daily EMA and reversed strongly to close slightly above the weekly EMA.
- The problem for bulls, with respect to breaking over the weekly EMA, is that Friday is a big bar closing just above the weekly EMA.
- Bulls will need a similar sized bull follow-through bar Monday to increase the odds of a breakout above the weekly EMA.
- What would have been better for the bulls is to produce smaller sized consecutive bull bars.
- Bears would still like a second leg corresponding to the leg down in December.
- Given the strength of the reversal up in January, the bears will likely need a wedge bear flag.
- The bulls would still like the market to be above the right shoulder low, so that they still have a chance at the Measured Move (MM) target of the Inverse Head and Shoulder (IVH).
Market analysis reports archive
You can access all weekend reports on the Market Analysis page.

