Market Overview: NASDAQ 100 Emini Futures
Note – I am in the process of moving my Charts off ThinkorSwim. I realized they don’t handle backadjusting of continuous futures contracts on weekly and monthly timeframes. The main impact of this is specific targets like all-time highs, Measured-move targets mentioned in prior reports.
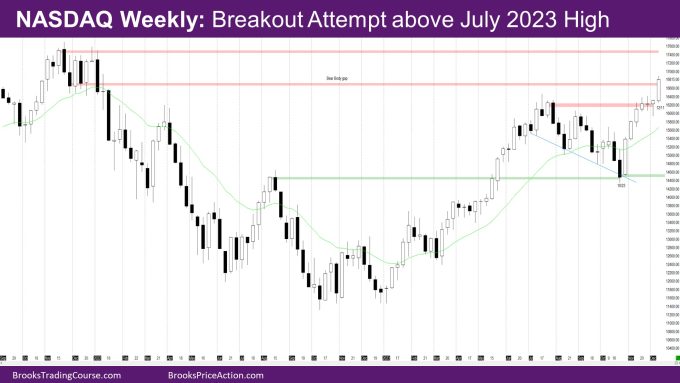
The NASDAQ Emini futures week is a bull trend bar with a small tail above. It is a breakout attempt above July 2023 high.
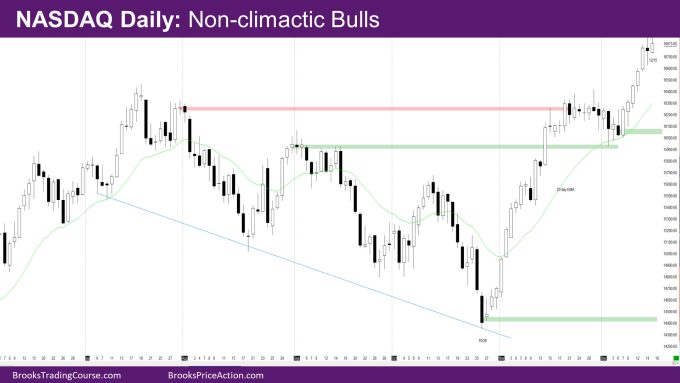
On the daily chart, the market broke out of the small trading range of the past 2 weeks with bull trend bars that are not climactic.
NASDAQ 100 Emini futures
The Weekly NASDAQ chart

- The week is bull trend bar with a small tail above.
- Last week was a bull reversal bar for the start of the second leg of the spike up in November.
- Bulls needed a good entry bar this week, and they got a strong breakout bar breaking out above the July high.
- Next the bulls need a good follow-through bar to confirm the breakout.
- On the back-adjusted chart, this week is closing the bear gap from the of week of 11/29/2021. Bulls need at least one more follow-through bull bar to confirm the bear gap is closed.
- The next target for the bulls is the high close of 2021.
- Bears want a bar closing below the low of prior bar like they did in July, and then follow-through bars.
The Daily NASDAQ chart

- Friday is a bull bar closing around the mid-point of the bar.
- Monday, Tuesday and Wednesday were good trend non-climactic bull bars breaking out far above the trading range of past 2 weeks.
- Bears were hoping for a reversal this week from the top of the trading range reached last Friday.
- This week is strong enough that it could be considered a spike again, which means at least 2 more legs up.
- The market also reached the Measured Move (MM) of the bodies of the November spike.
Market analysis reports archive
You can access all weekend reports on the Market Analysis page.

