Market Overview: NASDAQ 100 Emini Futures
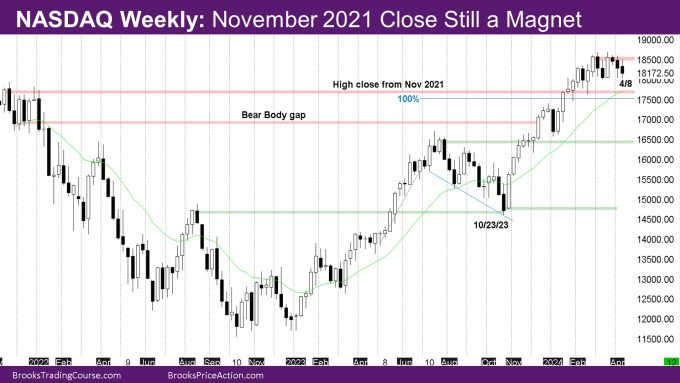
The NASDAQ Emini futures week is a bear doji inside bar. The market continues to be sideways since 2-26, although bears did manage 3 consecutive bear bars since September 2023.
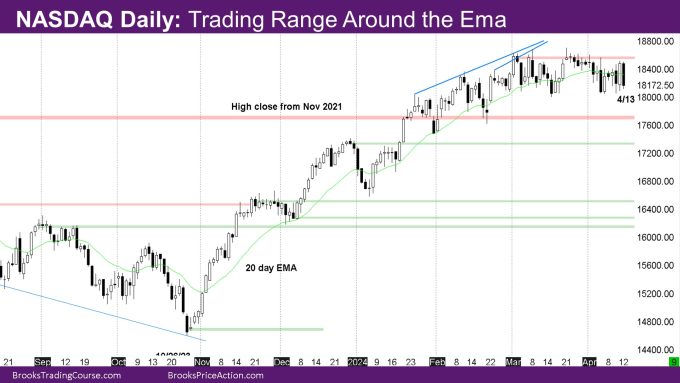
On the daily chart, the market oscillated around the exponential moving average (EMA). As was mentioned last week, it has been unable to close above the high close of March 1 at 18588.75. This will likely lead to lower prices to try and close the November 2021 bull gap.
So far, the month is a small inside bear bar with tails. As mentioned before, the monthly chart is in a bull micro-channel so there should be buyers below prior trend bull bars.
NASDAQ 100 Emini futures
The Weekly NASDAQ chart

- The week is a bear doji inside bar.
- It is a sell signal bar for what could be the 2nd leg down.
- As has been the theme for the past 6 weeks, the November 2021 close is still in play as it currently represents an open bull gap.
- The market is likely going sideways till the exponential moving average (EMA) goes above the November 2021 gap, in which case bulls will likely buy if the market gets to the EMA. This way bulls will still be able to keep the gap open.
The Daily NASDAQ chart

- The market is in a trading range around the EMA – neither side is getting consecutive trend bars.
- The market appears to want to test the November 2021 high close.
- Possibly the market will then be in a trading range between the November 2021 close and the high close of March 1.
- Monday and Tuesday were doji bars with small bodies.
- Wednesday was a doji with a bigger bear body.
- Thursday and Friday formed 2 bar bear reversal where Thursday was a bull trend bar and Friday was a bear trend bar whose body overlapped with Thursday.
Market analysis reports archive
You can access all weekend reports on the Market Analysis page.

