Market Overview: FTSE 100 Futures
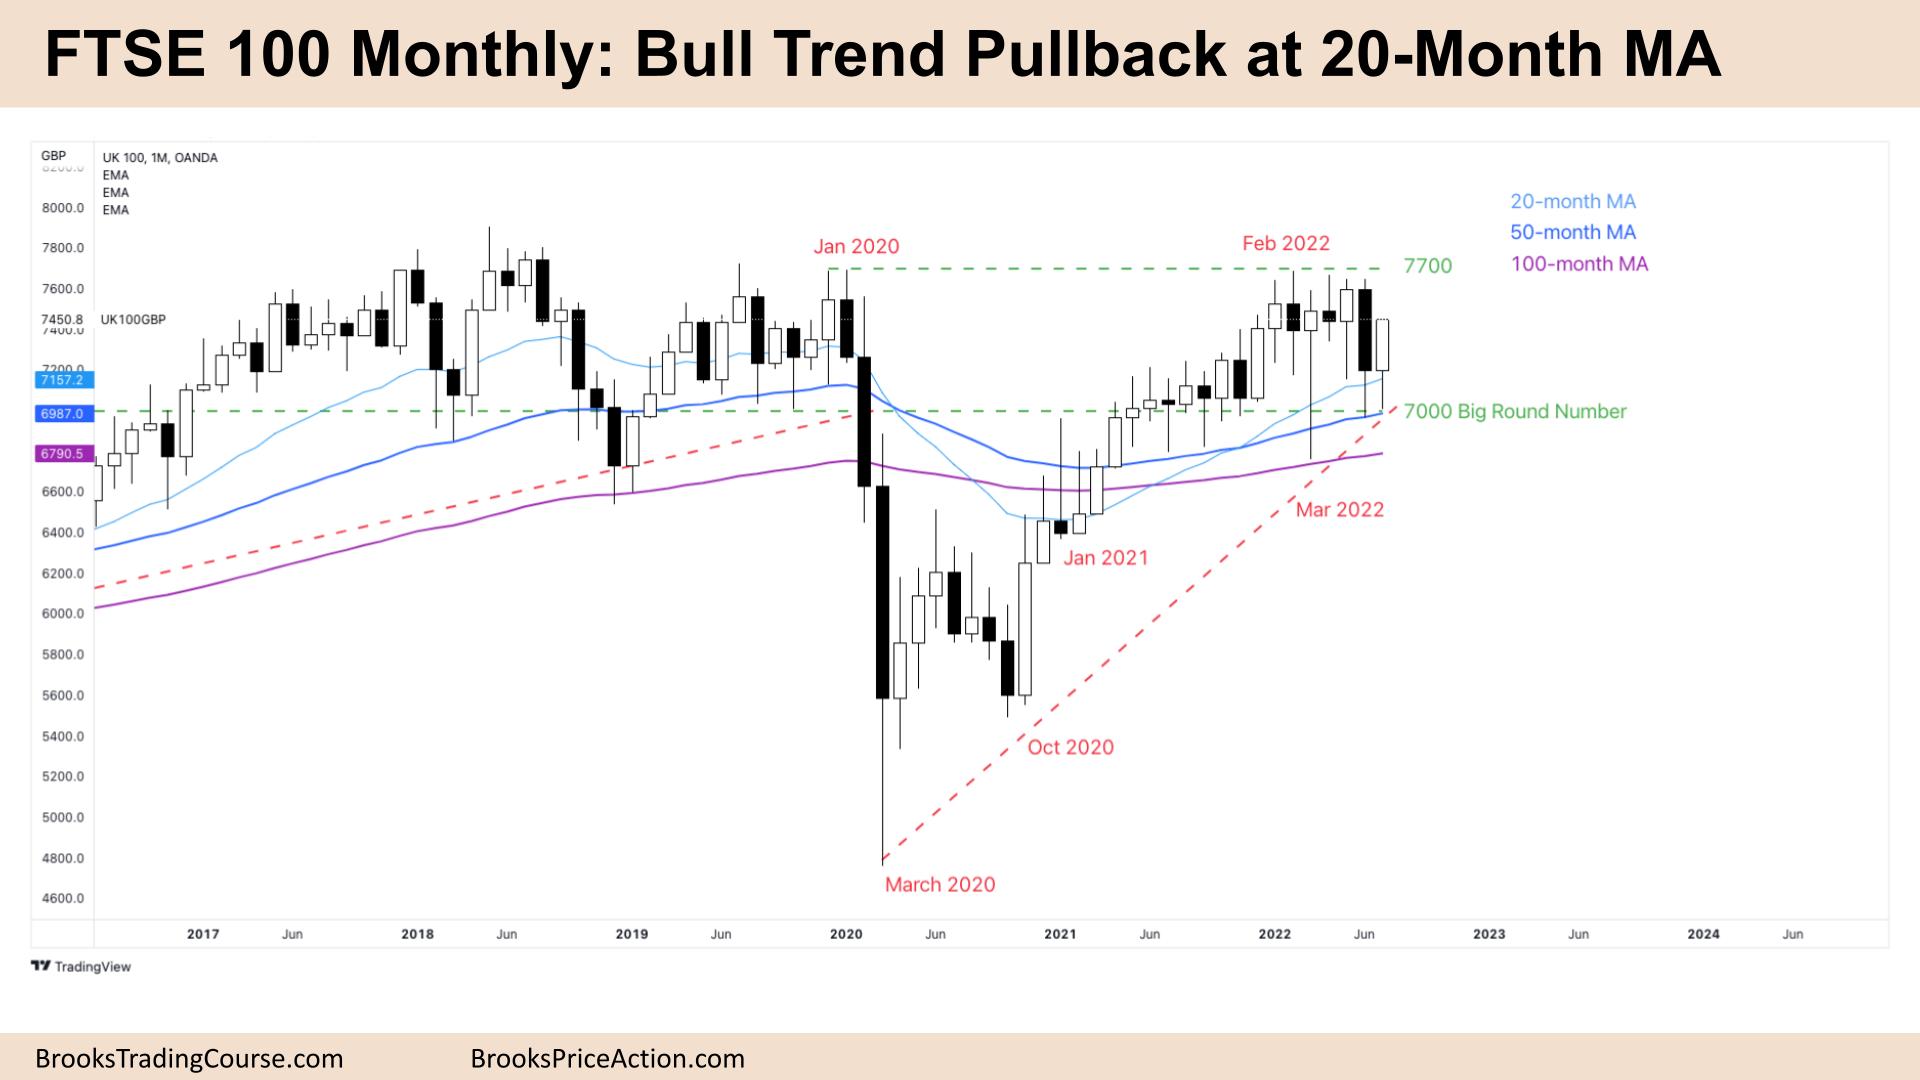
The FTSE futures market was a bull trend pullback at the 20-Month Moving Average (MA.) We are still always in long on the monthly and weekly charts but sideways, so limit order market above and below bars. Although this month looks like it is setting up a stop entry, there has only been one month in 12 that had a successful stop entry buy, so that will reduce the bulls enthusiasm. traders should expect sideways to up trading with tails to the upside next month.
FTSE 100 Futures
The Monthly FTSE chart

- The FTSE futures market on the monthly chart was a bull bar with a tail below closing on its high so we might gap up on Monday.
- For the bulls, it’s a bull trend pullback and a buy signal. But it’s not as bullish as it seems, there has not been a decent bull stop entry bar for many months, and in the middle of a trading range might lack follow through.
- It’s been always in long on the monthly chart since mid-2020 so the best the bears can get is probably a trading range and not a bear trend.
- Bulls have made money buying below bars with limit orders and at the moving average for two and a half years, they will keep doing it until it doesn’t work.
- The bulls see a pullback to the moving average in a bull trend, a micro double bottom with June (Micro DB) and a failure to break below the tight trading range from mid-2021.
- They want a High 1 buy signal above July for follow-through to break above the all-time highs (ATHs).
- The bears see a 50% pullback after a failed breakout above a trading range above and want a measured move back to March lows.
- The bears see the biggest bear bar since the COVID crash in June and a chance to short again at the top of a trading range.
- Bears see March and June as a sign of weakness and want a double top and a major trend reversal. But they have been unable to create consecutive monthly bear closes since September 2020.
- They know the math is better for selling near the top of a trading range and will sell above this week.
- It’s been 20 bars above the moving average and it’s a trading range on the monthly chart so institutions might look to buy a lower pullback before breaking the all-time high.
- If they can get consecutive bull bars closing on their highs that might get us above the all-time high.
- If the bears can get another bar like June closing near its low, they might get a two-legged pullback sideways to down to below the moving average.
The Weekly FTSE chart

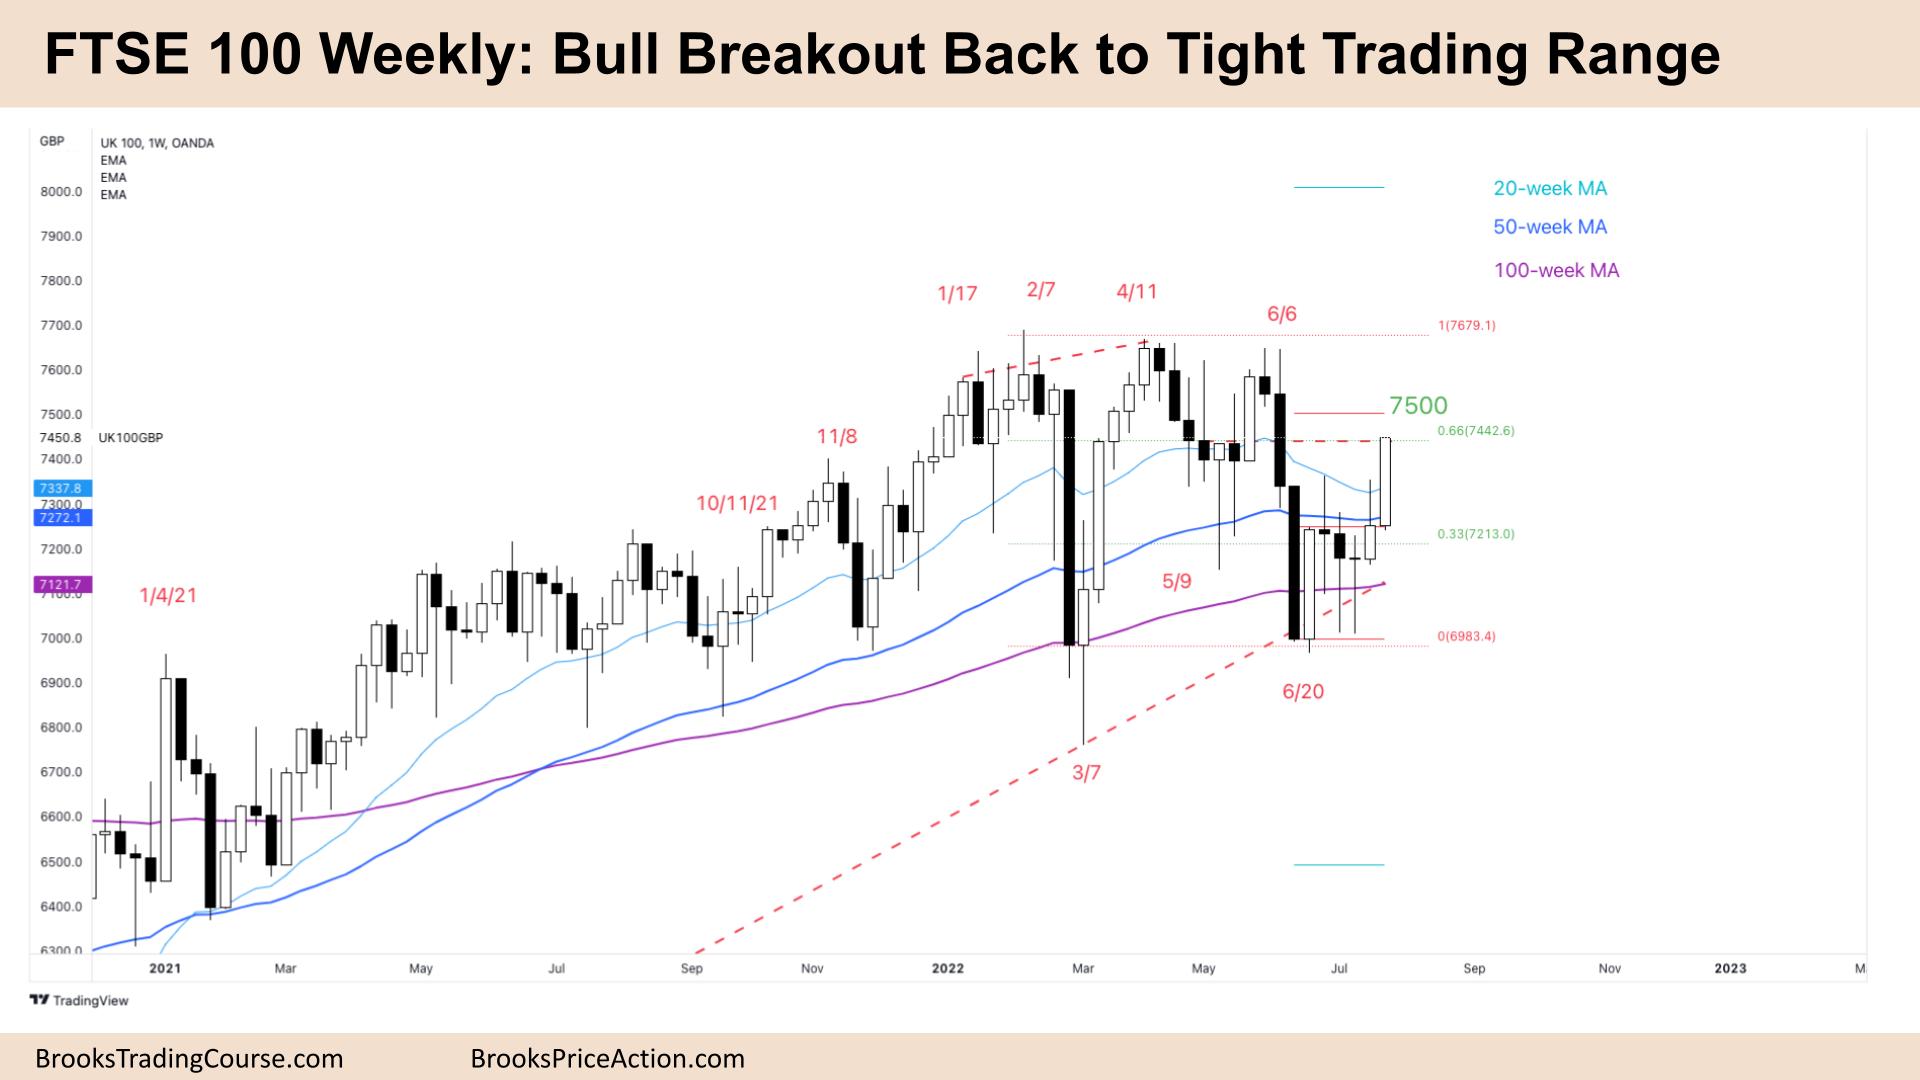
- The FTSE futures was a bull bar closing on its high so we might gap up on Monday.
- The bulls see a breakout from a double bottom and a sell climax and are just below the measured move target. It is reasonable for bulls to exit there and bears to scale in.
- We have been saying for the past few months that the tight trading range at 7400 would be a magnet and we would probably come back here. It might even be the middle of a trading range for the next few months.
- It’s always in long, consecutive bull bars closing above their midpoints and one large and closing on its high, but the context is not great, the top third of a trading range.
- The bears see a trading range and sideways market. The bears have scaled in short above here all year and made money, it is reasonable to expect them to continue.
- The bears see a two-legged pullback sideways to up to the moving average after a bear spike.
- The bears see we have spent 7 of the past 10 weeks under the moving average so it is reasonable to sell around here.
- But it’s a bad sell signal, a bull breakout bar, so they might wait a week for a pause bar to sell a Low 1.
- Traders should expect follow-through buying up to the measured move target and possibly through the tight trading range
- Most traders should wait for a reasonable stop entry signal in either direction. Because it is always in long, beginners should only trade buys.
- Experienced traders might start to scale in at the magnets before looking at low-risk, low probability but high-reward swing shorts back to the base on the trading range below.
Market analysis reports archive
You can access all weekend reports on the Market Analysis page.

