Market Overview: FTSE 100 Futures
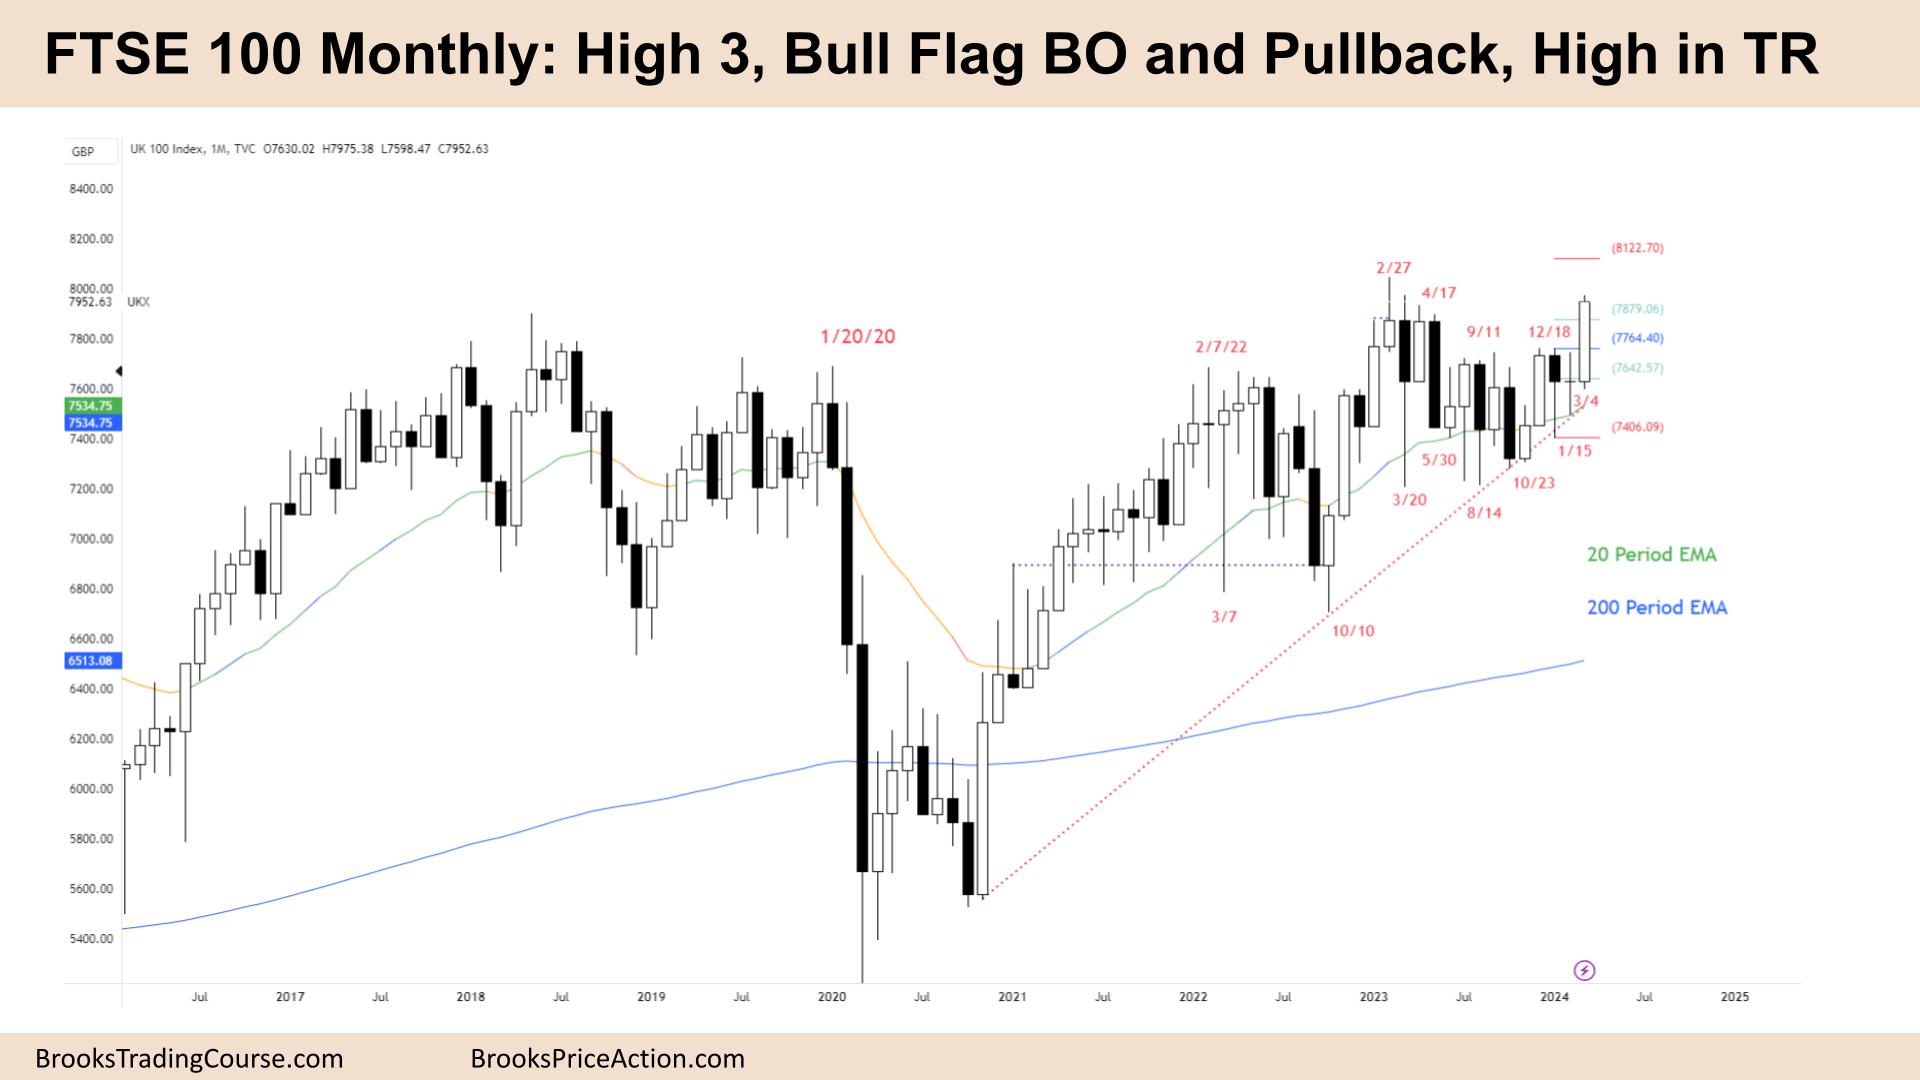
FTSE 100 futures went higher last month with a High 3, a wedge bull flag right above the moving average. Breakout mode lasted for a long time so traders want the market to move quickly to targets. But in a trading range the pullbacks are deep so expect more sideways still. Strong buy signal here in a broad bull channel so should get follow through. Some traders will wait for the pullback into the bar before scaling into longs.
FTSE 100 Futures
The Monthly FTSE chart

- The FTSE 100 futures went higher with a bull breakout and pullback from a bull flag, a High 3.
- The higher time frame bulls see two clear legs up from the COVID crash and the past 12 months as the 2 legged pullback from the end of the second leg.
- This push up would make leg 3 and might turn sideways into a trading range.
- Often the final leg in a move is a parabolic wedge, so a PWT here.
- There is a measured move above the prior high which is where we might be heading.
- The bears see a trading range and a failed breakout above the high. There are a lot of sideways bars and they retraced more than 50% of the prior leg.
- They will likely sell above the highs and scale in higher.
- But now we are above both moving averages it is better to be long or flag.
- Strong buy signal right above the moving average in a bull trend so it is a buy the close and buy above trade.
- What is the expectation? No two consecutive bull bars in a long time so likely to pullback next bar.
- If we break strongly to the upside that would be more of a surprise and a second leg more likely.
- Some bulls will wait for a pullback into the buy zone before entering. You can do this on many signals including the High 3.
- This strategy reduces risk but the cost is missing 20-30% of trades.
- March and April are generally quite bullish.
- Always in long so expect sideways to up next month.
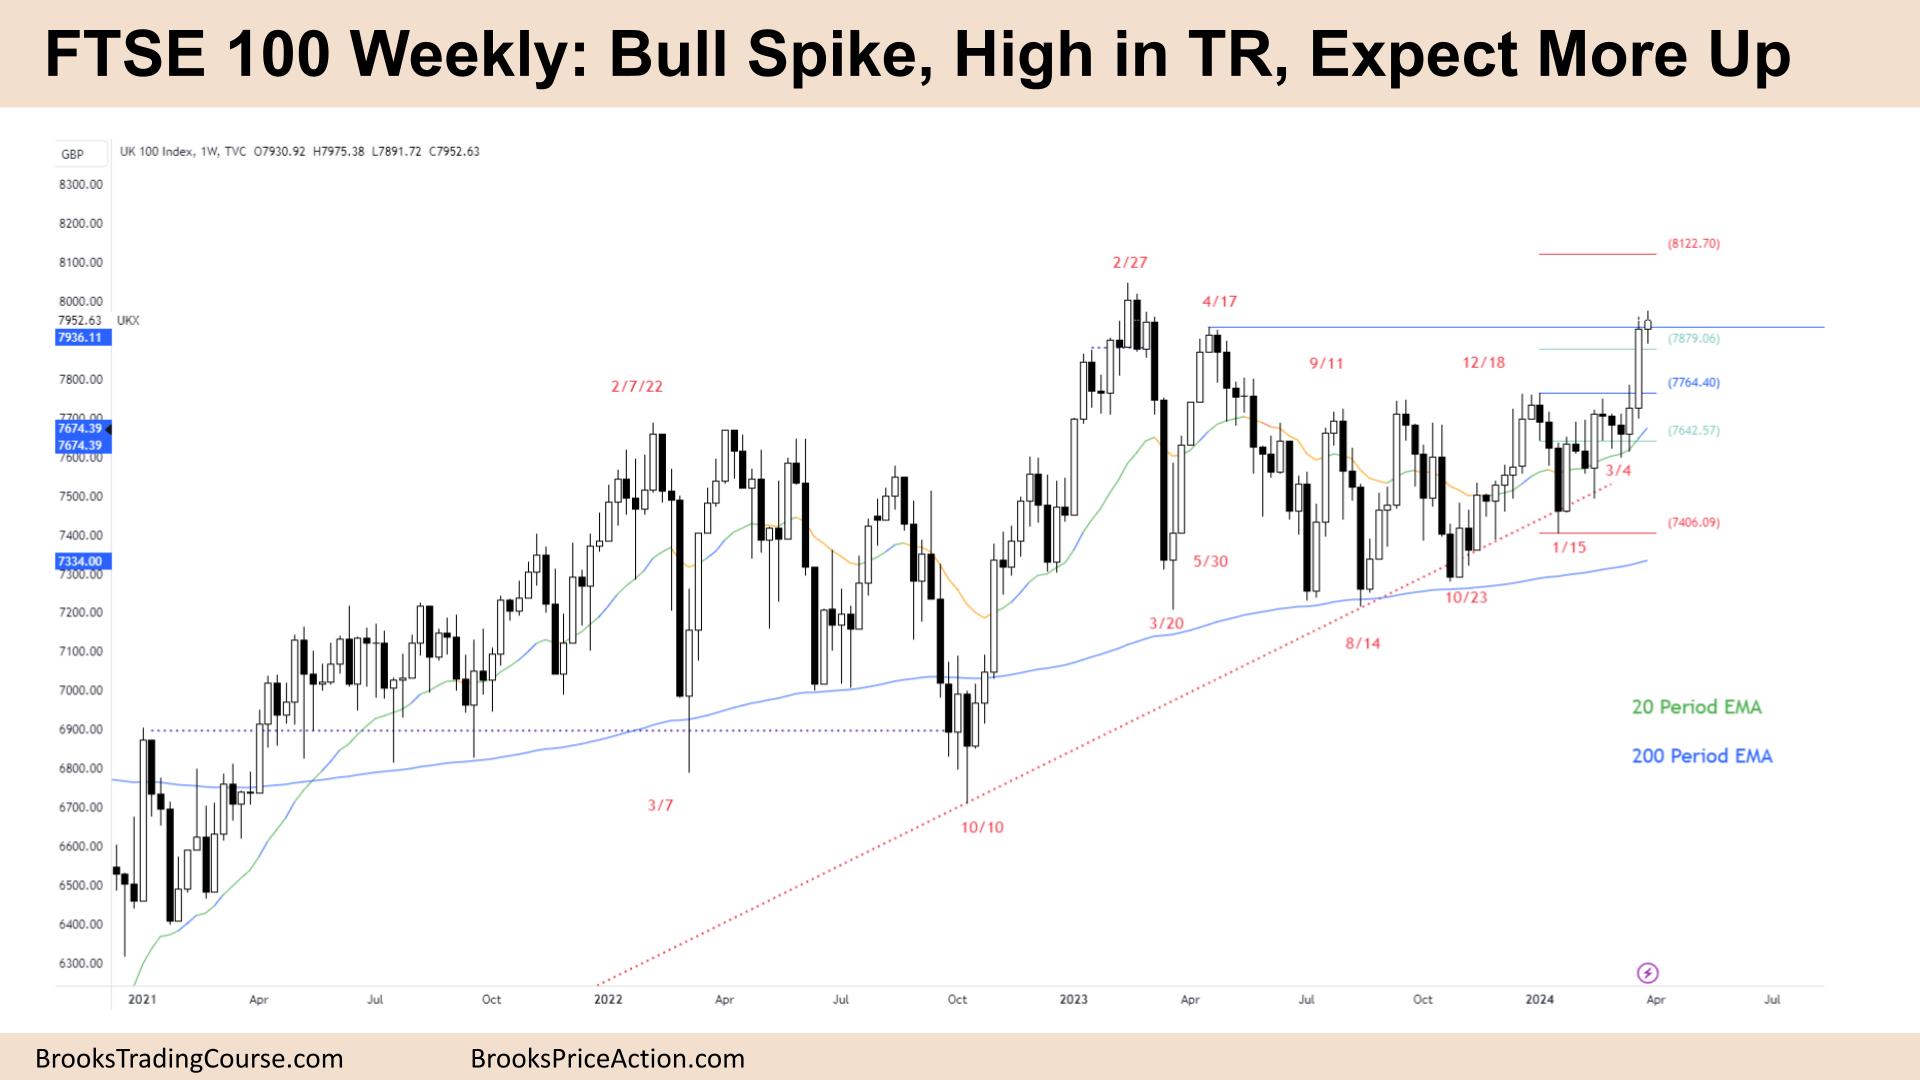
The Weekly FTSE chart

- The FTSE 100 futures went above last weeks high but did not close above it so more sideways.
- Bulls see a breakout and follow through after a huge bull spike. They want 2 legs up, maybe three in a spike and channel bull trend.
- Bears see a buy climax with bad follow through high in a trading range after breakout mode.
- Whenever the market does something to make you believe there is clarity, you should assume it will pullback soon.
- There must always be two reasonable opposite trades. Otherwise the market rushes back to support or resistance.
- Very clearly always in long here, but how come no one bought last week?
- Big bull spike so probability is high that means risk reward is bad. Bears can short up here with a small stop and a 40% probability of making 2:1.
- Bears had 3 good bear bars and would have shorted above it. So they are stuck. Some would have exited and some others would be scaling in. Most traders should not do this. The losses will be too large to have a reasonable equity curve.
- Bears could argue 3 legs up from January. But the last one broke strongly above the prior swing point.
- Broad bull channel on the higher time frame so deeper pullbacks are to be expected. Traders should trade a smaller size and look to scale in lower than they would like.
- If you look left, the pullbacks have been 60%+ so we could pullback to the breakout point.
- Although I think we will stay above that now the monthly is a strong buy signal.
- Always in long so it is better to be long or flat.
- Expect sideways to up next week.
Market analysis reports archive
You can access all weekend reports on the Market Analysis page.

