Market Overview: FTSE 100 Futures
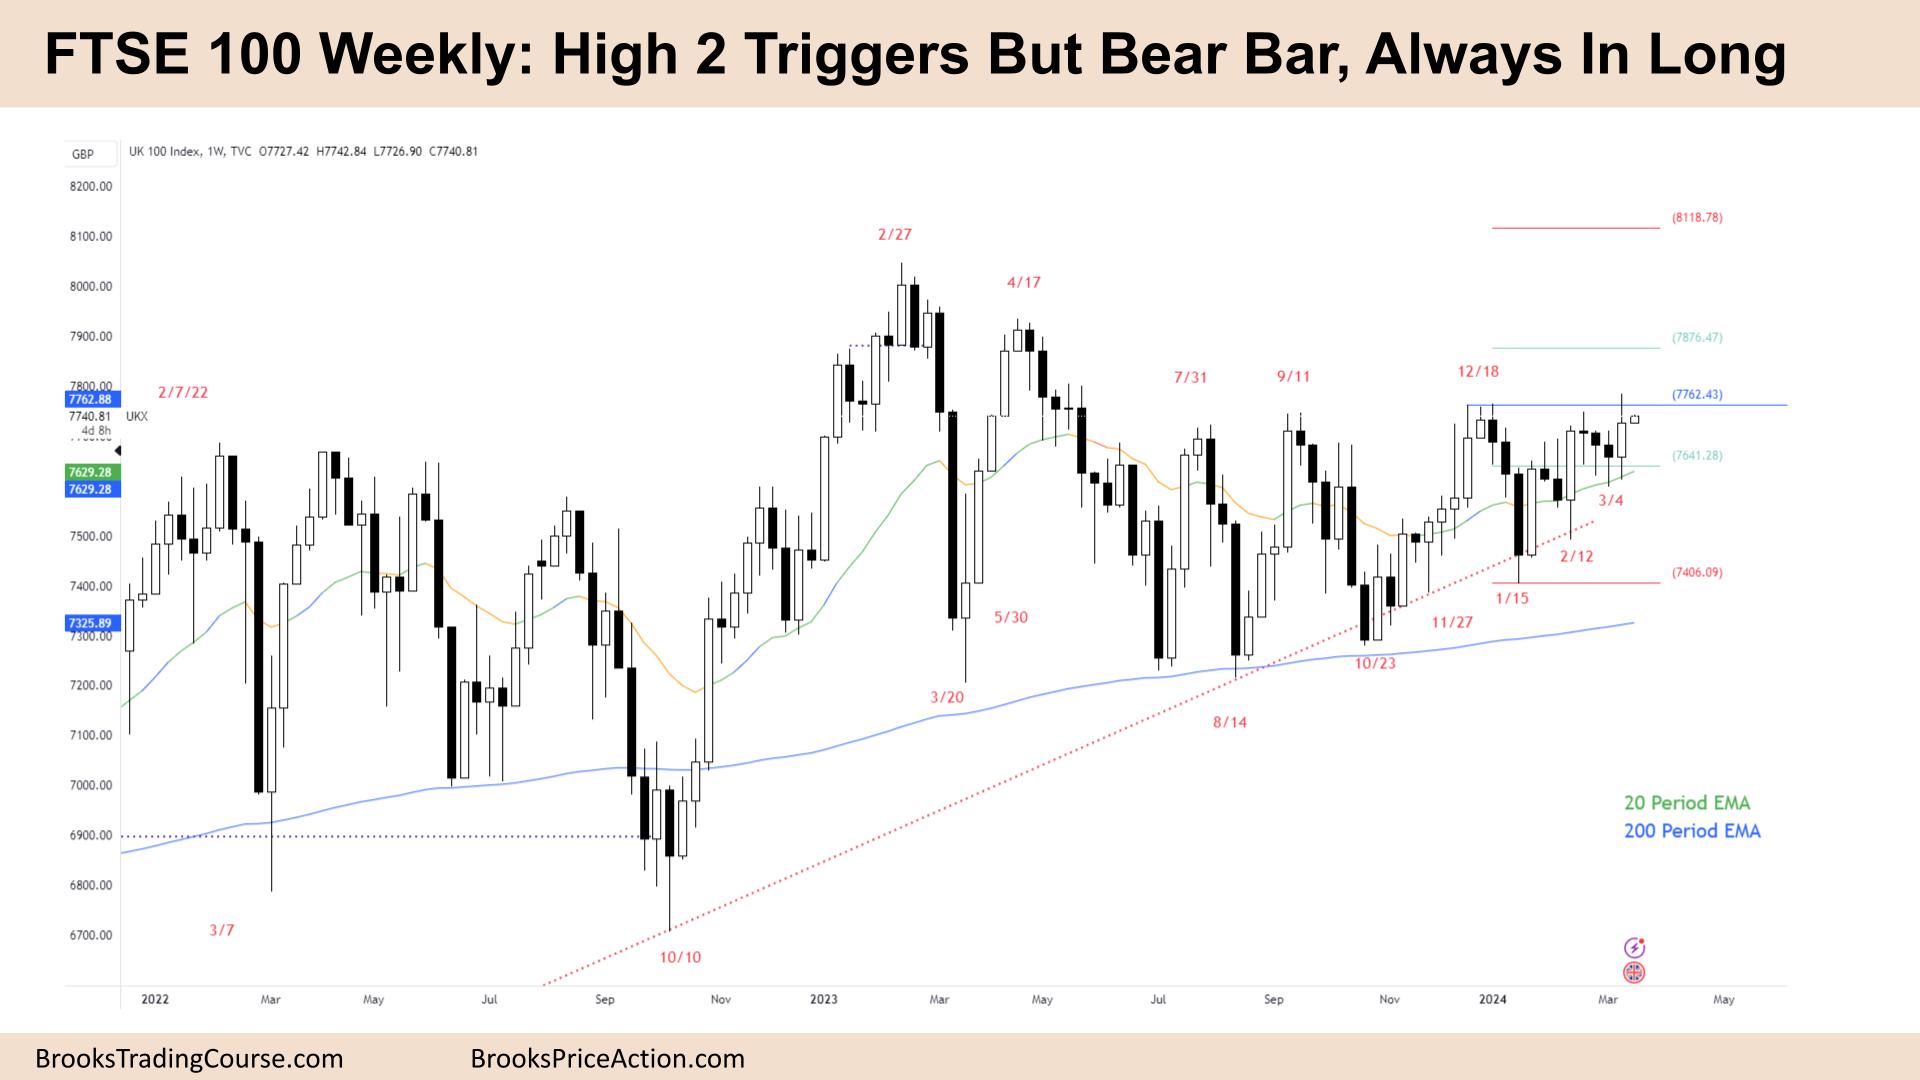
FTSE 100 futures moved higher last week when the High 2 was triggered. It looks like a bull breakout of BOM in a broad bull channel. Sloping up MA and big bull bars over the MA are good signs for buyers at the MA and lower. MM targets up are around 8000. Against the bull case is the possible failed breakout of a TR and a bear flag. Why can’t bulls get far above the prior highs? There is nothing to sell yet on this timeframe, so long or flat.
FTSE 100 Futures
The Weekly FTSE chart

- The FTSE 100 futures moved higher with a bull bar with tails above and below when the High 2 triggered.
- We are starting to close above the MA again, and we are above the 200 and the 20 MA, so we will likely be always in long.
- Expect sideways to up next week.
- The High 2 triggered in a bull environment so we should expect buyers below as well.
- The bears had two chances to turn it down. They had three consecutive good bear bars but bad follow-through.
- Bears shorting above prior highs will be concerned that we broke above.
- Some limit order bears will sell again above the 3 bear bars, but it was likely a scalp only.
- Bulls here expect a breakout and measured-move up, so will have bought last week for a 2:1 up.
- Can next week do anything to encourage traders to short? Not at the lows or at the MA, so the only sell is above. That means we are likely going higher.
- The bears might create an inside bar here, but I wouldn’t sell it.
- They would need two very good bear bars, a possible wedge top and a higher high double top. But they have done that 3 times already in the past 6 months.
- Expect buyers down to the MA and below last week. Bear scalpers short here will likely exit there.
- What is next week is a big bear bar closing on its low. I can’t rule out any possibility, so that would be a likely fade bar. And only a credible short if it got follow-through.
- In bull trends, High 2s are forgiving to traders. When they fail, they typically create strong MM down, which allows traders to recover.
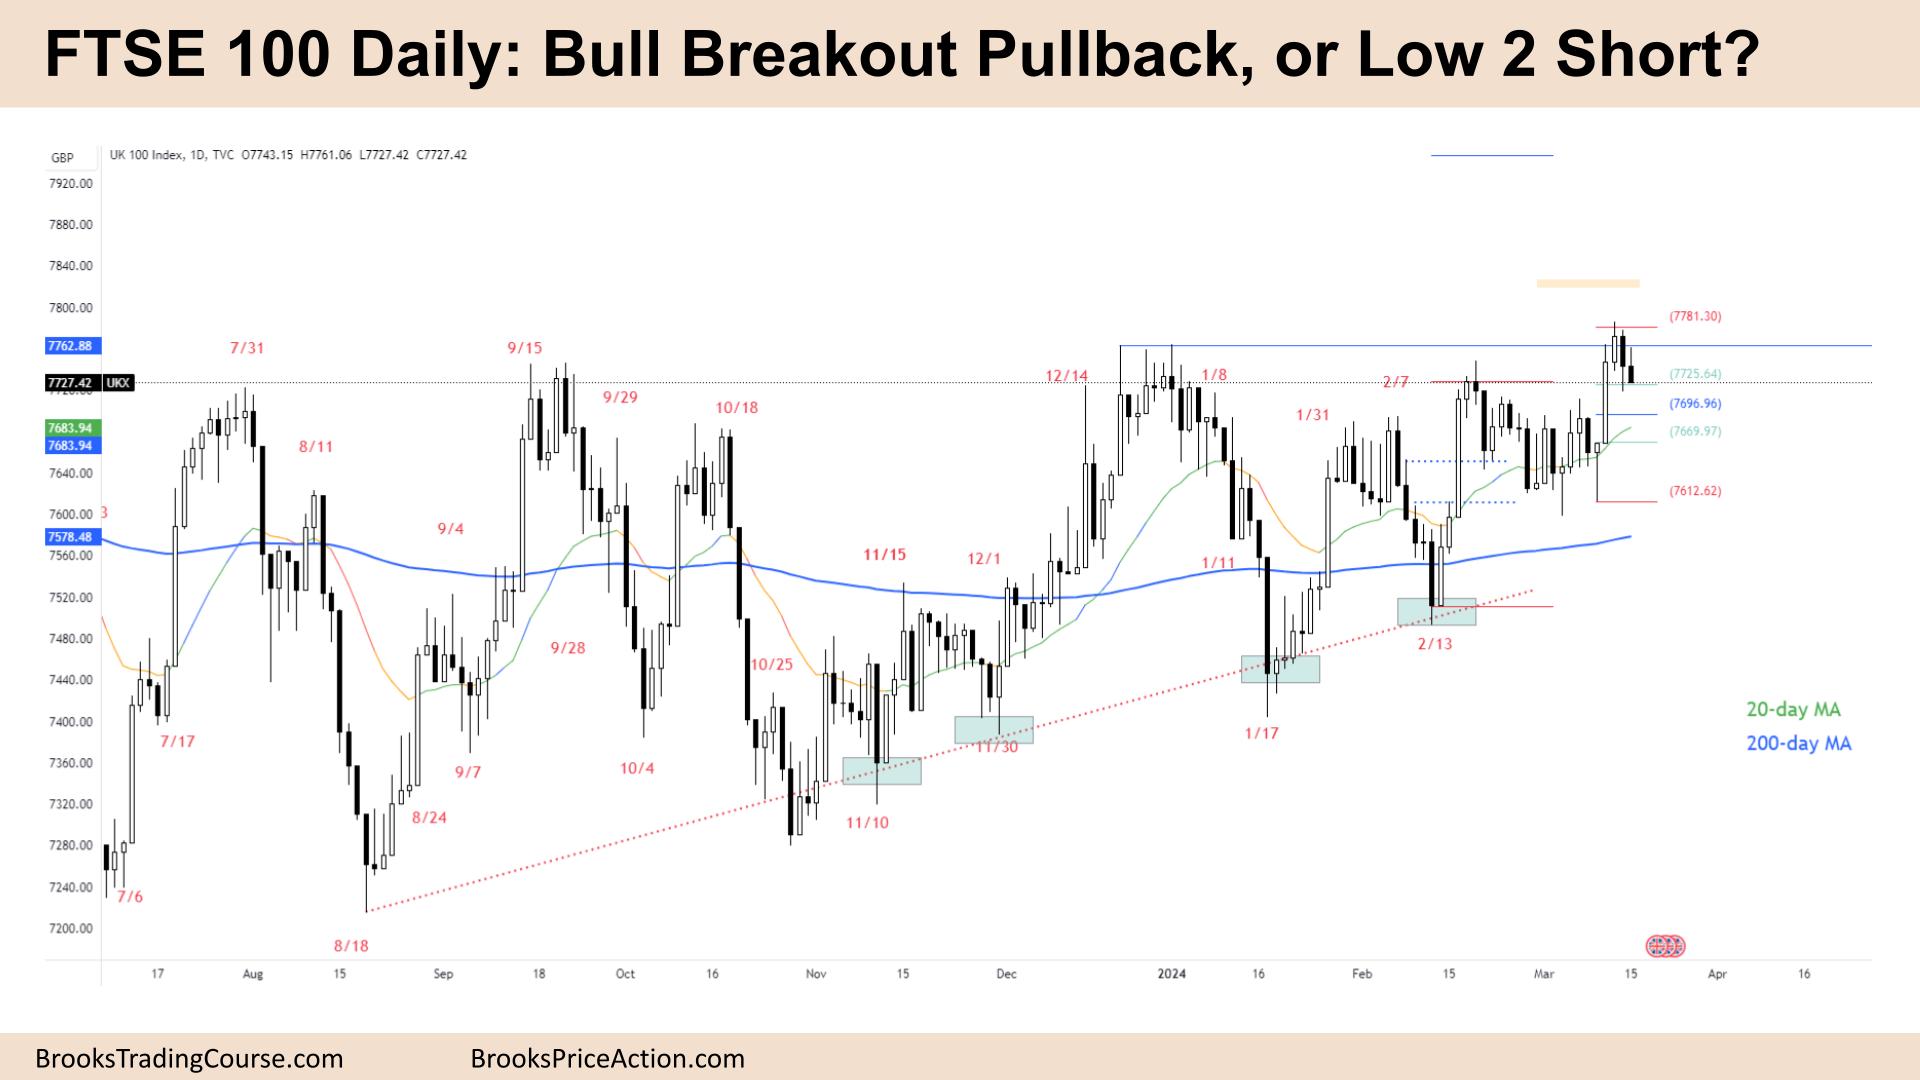
The Daily FTSE chart

- The FTSE 100 futures moved lower on Friday, with a bear inside bar closing on its low.
- The daily chart has been in a broad bull trend and has started to move away from the 200 MA.
- The bulls now have three strong bull spikes, consecutive bull bars, and a closing far above the MA. So, it is the early stages of a bull breakout in a higher time frame.
- But in a trading range it often looks most bullish at the top and most bearish at the bottom. Traders are better off buying near the MA and scaling into their positions.
- The bulls finally got a stronger higher high, which means likely buyers below and at the MA.
- You can see the tail on the bars for the bear, then an inside bar. The bulls might be disappointed and expect one more bar down.
- But we have broken out of another bull flag. A bull flag breakout pullback is one of Al’s best trades and a reliable long setup.
- Measured move targets of the range could be about 8000.
- But expect deep pullbacks to enter your first position.
- Anything to short here? Bears could argue a wedge top but without a trigger yet.
- My problem with the short argument is the 6 higher lows on this chart. So more like any strong move down hits a trendline and finds scale in bulls.
- HH MTR? Stretching the meaning a little but still possible if there is good follow-through. I suspect any bears would wait to enter their full position after a lower high, a head and shoulders top, rather than now.
- We are likely always in long, so traders should be long or flat.
- Expect sideways to up next week.
Market analysis reports archive
You can access all weekend reports on the Market Analysis page.

