Market Overview: FTSE 100 Futures
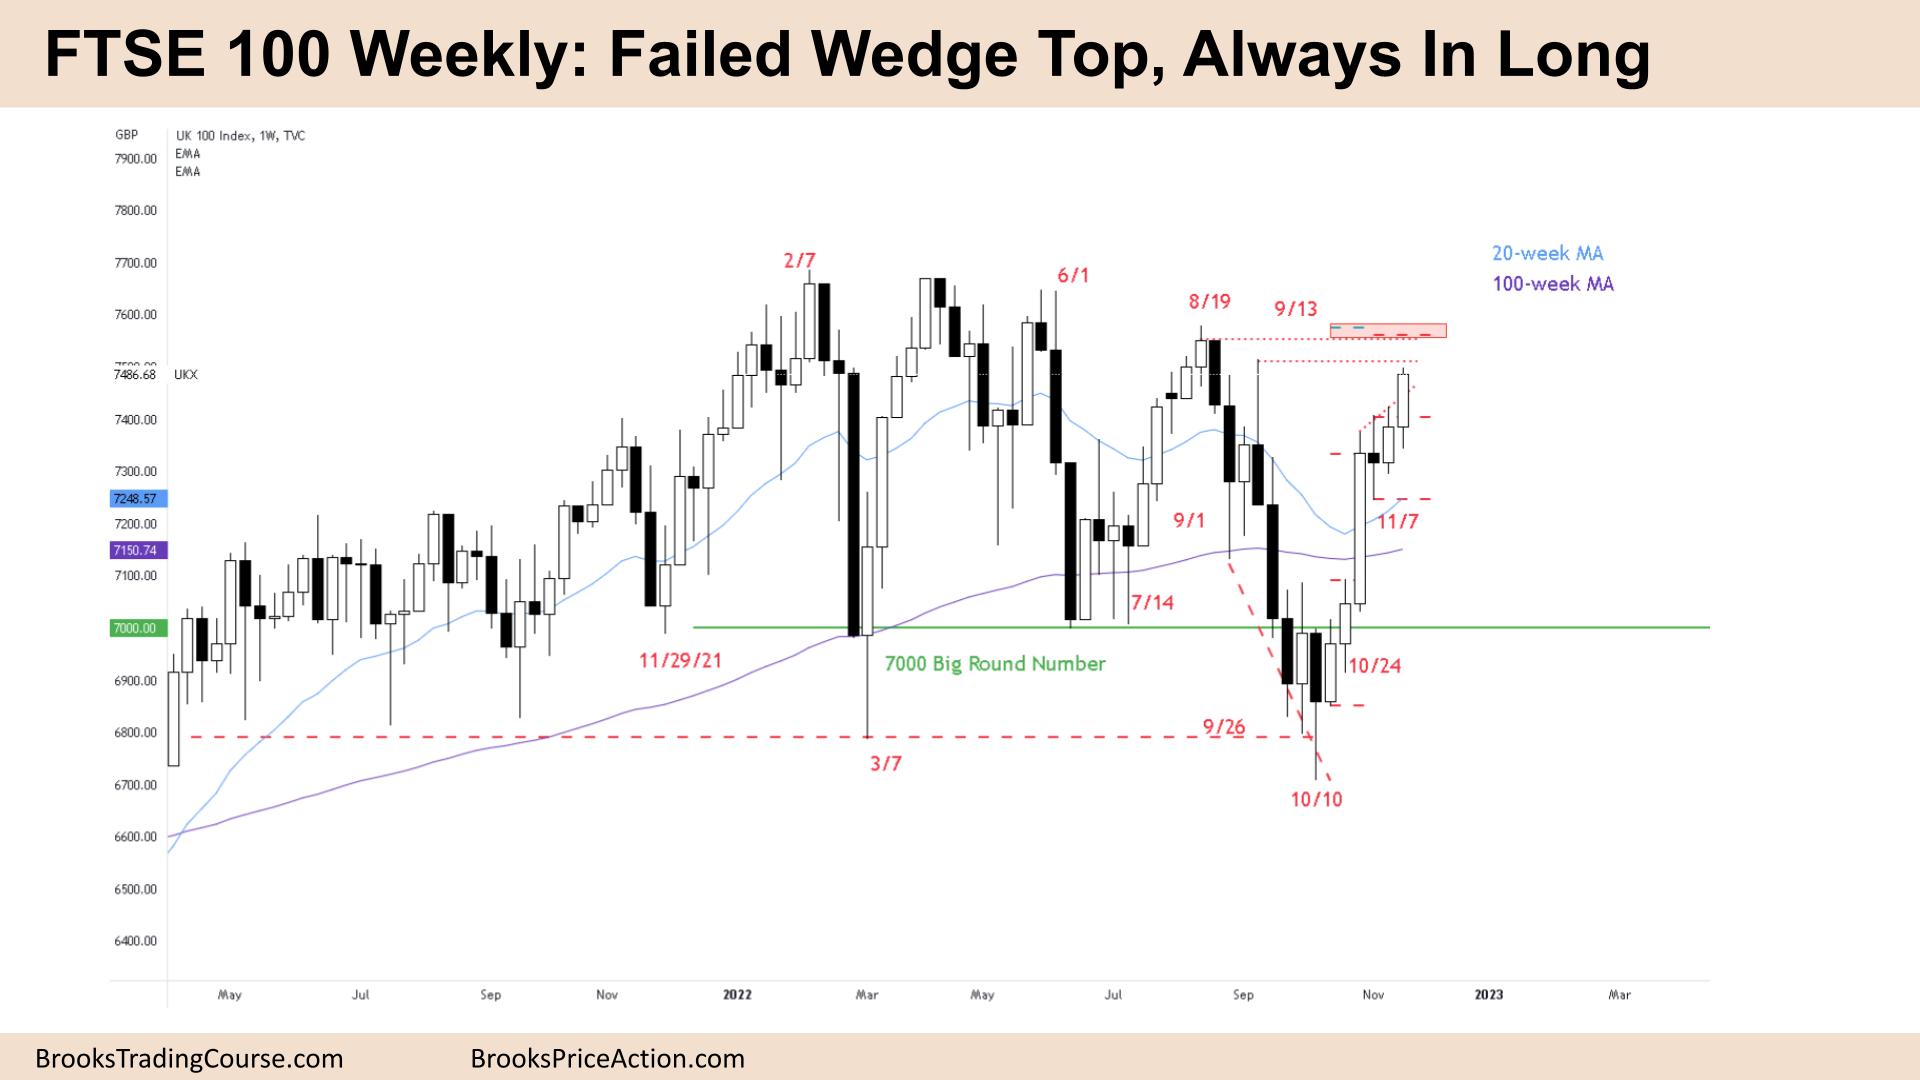
The FTSE futures market moved higher with a FTSE 100 failed wedge top and we are still always in long. The bulls have measured move targets just above and want to reach them. They also have some trapped traders from before that might need to get out. The bears shorted the wedge so are trapped below, they are willing to sell high in the trading range as risk is too much for the bulls to breakout. Better to be long or flat right now.
FTSE 100 Futures
The Weekly FTSE chart

- The FTSE 100 futures was a bull bar closing on its high, so we might gap up on Monday.
- It is two consecutive bull bars and the 7th bar in a bull micro channel. Traders will likely buy the first bar to close below the low of a prior bar.
- For the bulls, it is a failed wedge top. This week was a breakout (BO) and so they will look for a BO test and then look for a measured move from the size of the wedge. That is about the Aug 19th high.
- The bears see a broad bear channel or a trading range. They know the math favors getting short at the top of a trading range, and they are looking for a second entry to sell.
- Last week was a buy signal, so better to be long or flat.
- Scale in bulls will look to add on lower if we pull back to wedge. It’s ok to get out below a bear bar, closing below its midpoint, or last week.
- Some limit bears sold the wedge top and then will look to sell again higher and get back to breakeven or hold for a swing back to the wedge.
- Trading ranges disappoint traders, so it looks most bullish at the top and most bearish at the bottom.
- The bulls need a break above the Sept 13th high to create a higher high and change the structure from a broad bear channel.
- Bulls buying here need a stop below the bear doji and will be quick to exit if the bears get a strong reversal next week.
- Most traders will expect the first reversal to be minor.
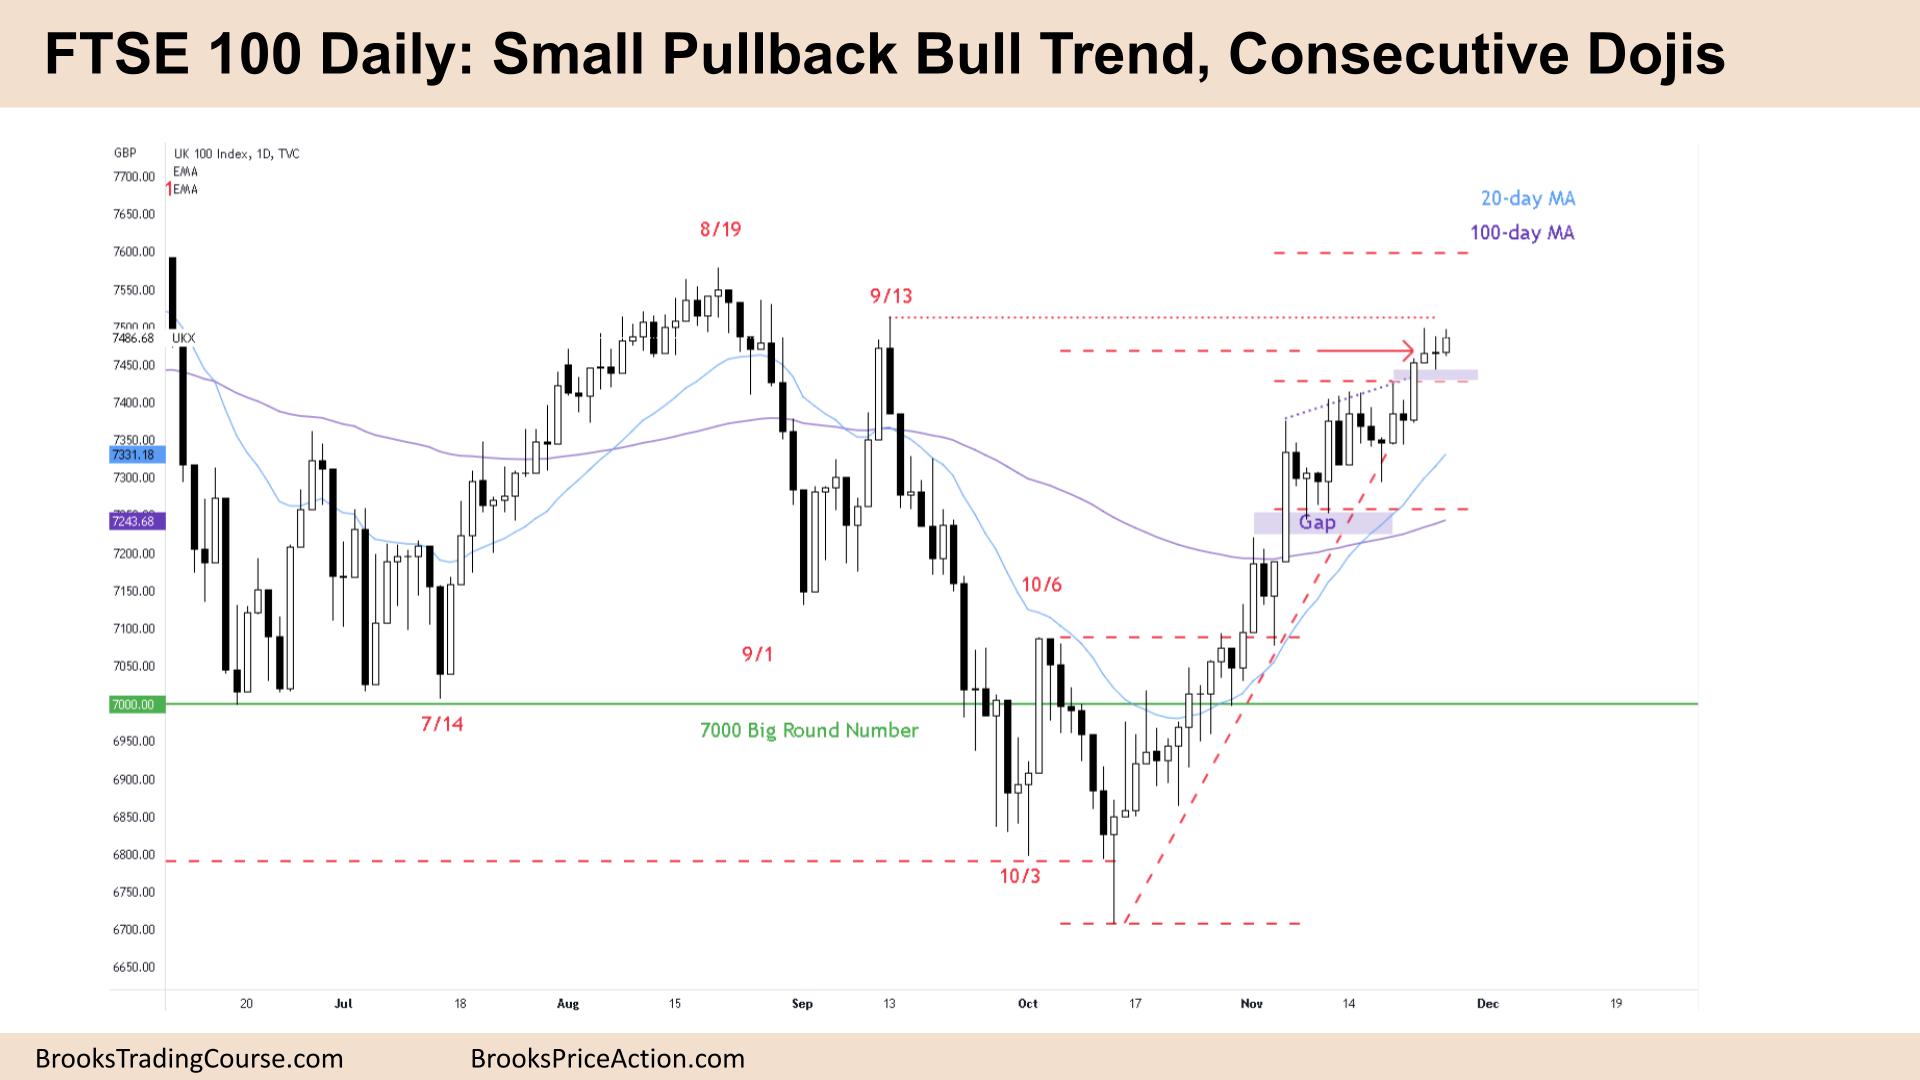
The Daily FTSE chart

- The FTSE 100 futures was a small bull with a tail on top on Friday which is reasonable because of the Thanksgiving Long Weekend in the USA.
- It is likely bears are trapped in the failed wedge top below and the breakout forced some to cover shorts while scale in bears are shorting trying to close the gaps and get back to their entries.
- The bulls see it is a small pullback bull trend and bears have struggled to make money on the daily chart.
- But it is not as bullish as it could be as the bulls switch from buying above bars to buying below. It is likely we will form a trading range soon.
- The bulls want to reach their second measured move target above the August 19th high.
- it is not a coincidence that the target is there. Computers play chess many moves ahead to force traders to make decision to get there.
- The bears see we are going sideways at a cluster of measured move targets. They see a broad bear channel, a possible double top wedge bear flag and a lower low.
- The bears suspected bulls were trapped up here before and might need to get out, so they will look to sell above.
- The bears need a sell signal but still havent got a decent one to work as yet.
- The channel is tight so traders will expect the first reversal to be minor.
- We havent touched the moving average in over 20 bars so when we get back there, bulls might buy to create a second leg.
- Better to be long or flat. Bulls can exit below a reasonable bear bar closing near its low.
Market analysis reports archive
You can access all weekend reports on the Market Analysis page.

