Market Overview: FTSE 100 Futures
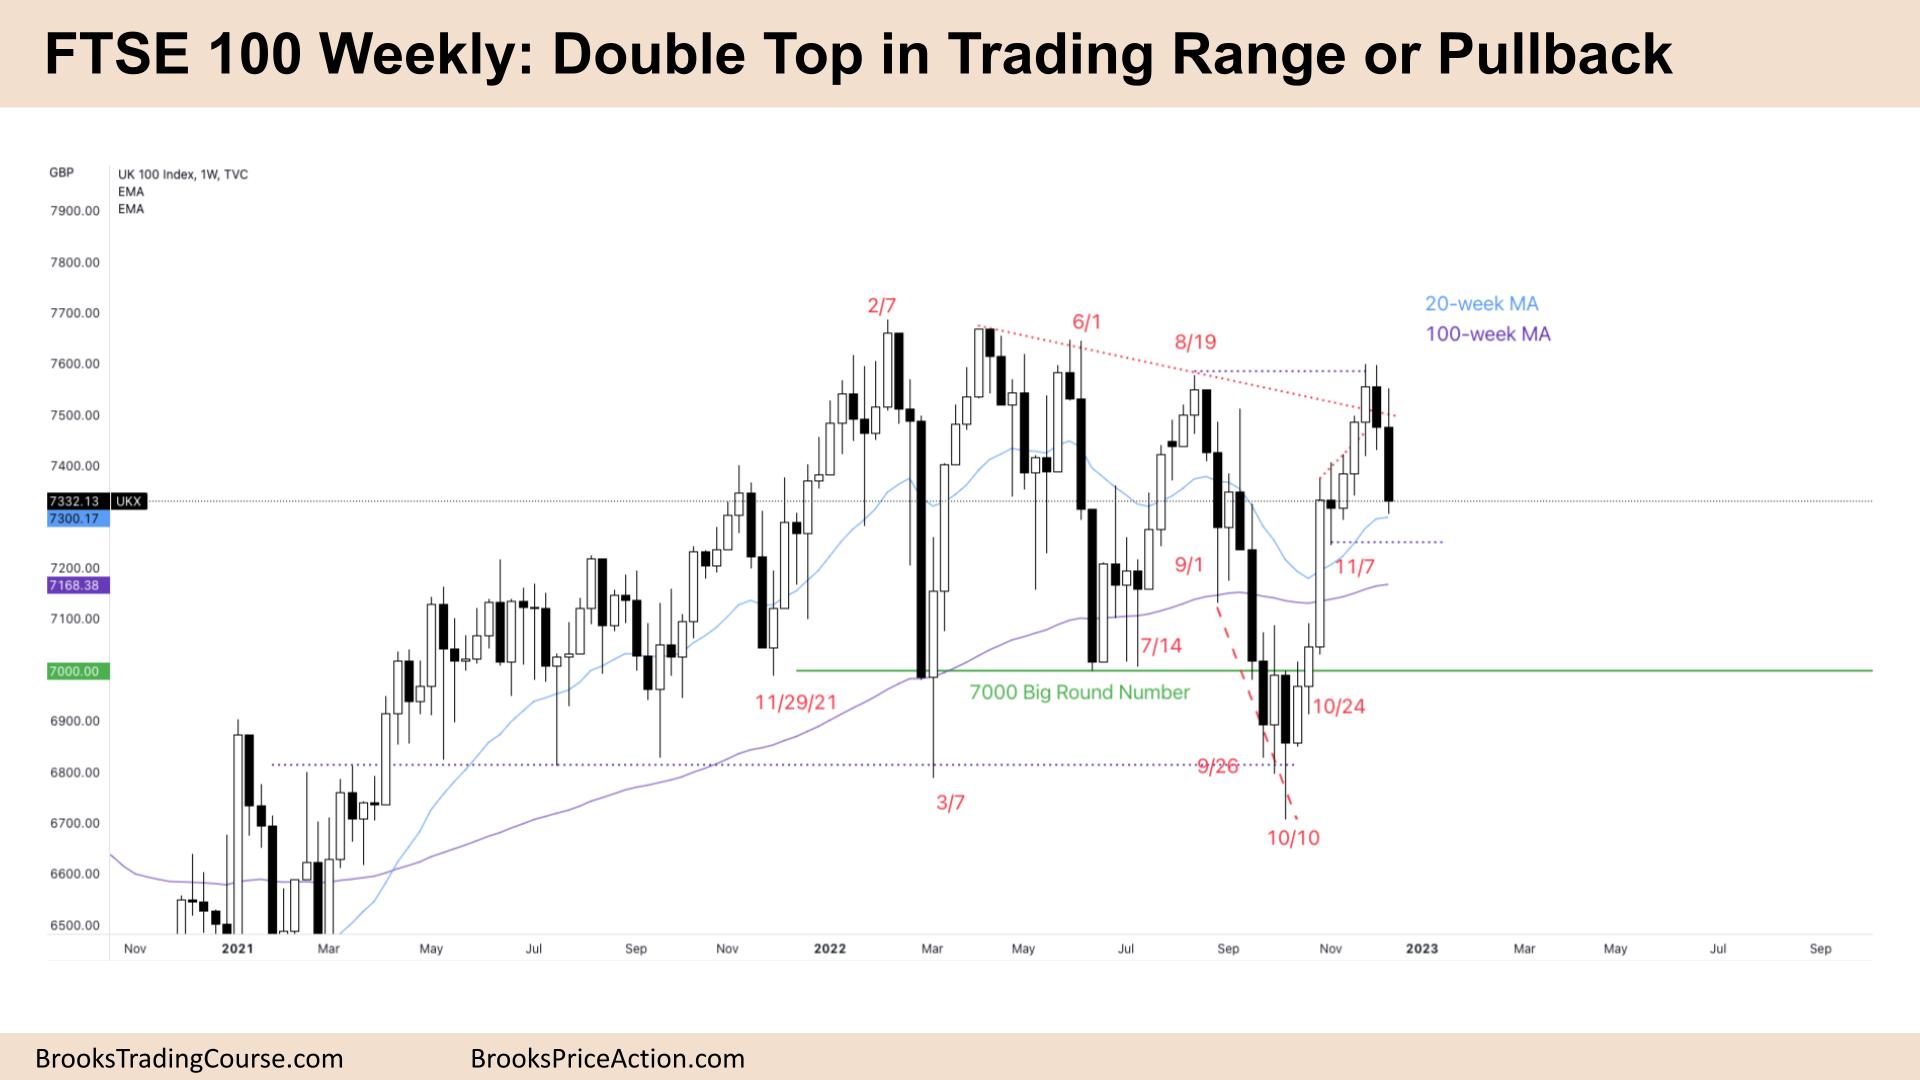
The FTSE futures market formed a FTSE 100 double top high in a trading range last week, or is it a pullback? The bulls had a tight bull channel, so they expected a second leg after a corrective move sideways to down. It is likely we will test the breakout point in November. Bulls want a bear trap and reversal for a breakout above. The bears want continuation for a sharp move back down into the middle of the range.
FTSE 100 Futures
The Weekly FTSE chart

- The FTSE 100 futures was a bear bar closing on its low, so we might gap down on Monday.
- It is two consecutive big bear bars so we are likely always in short.
- The bulls see a pullback after an 8-bar tight bull micro channel. It is a spike and likely to have a second leg sideways to up.
- The bulls see Nov 7th as a target for the pullback as a prior breakout gap to reverse and continue higher.
- The bears see a strong sell signal high in a trading range, so a reasonable short. The bears want a second leg sideways to down, probably to the first pullback in the middle of the trading range.
- Last week’s bear bar wasn’t an ideal sell signal, so we might need to go back and test it before a second leg further down.
- This trading range has had sudden big moves, so although it is bearish, look left and see the corrections up are just as fast.
- Bulls will look to scale in at the moving average, seeing last week’s bar as bulls exiting and not as bears selling. They know some bears sold at Nov 7th and are trapped.
- Bears will look to create a lower high than last week. They succeeded in preventing a higher swing point with Aug 19th, so at least they have a trading range to convert into a deeper trend down.
- Most traders should be short or flat.
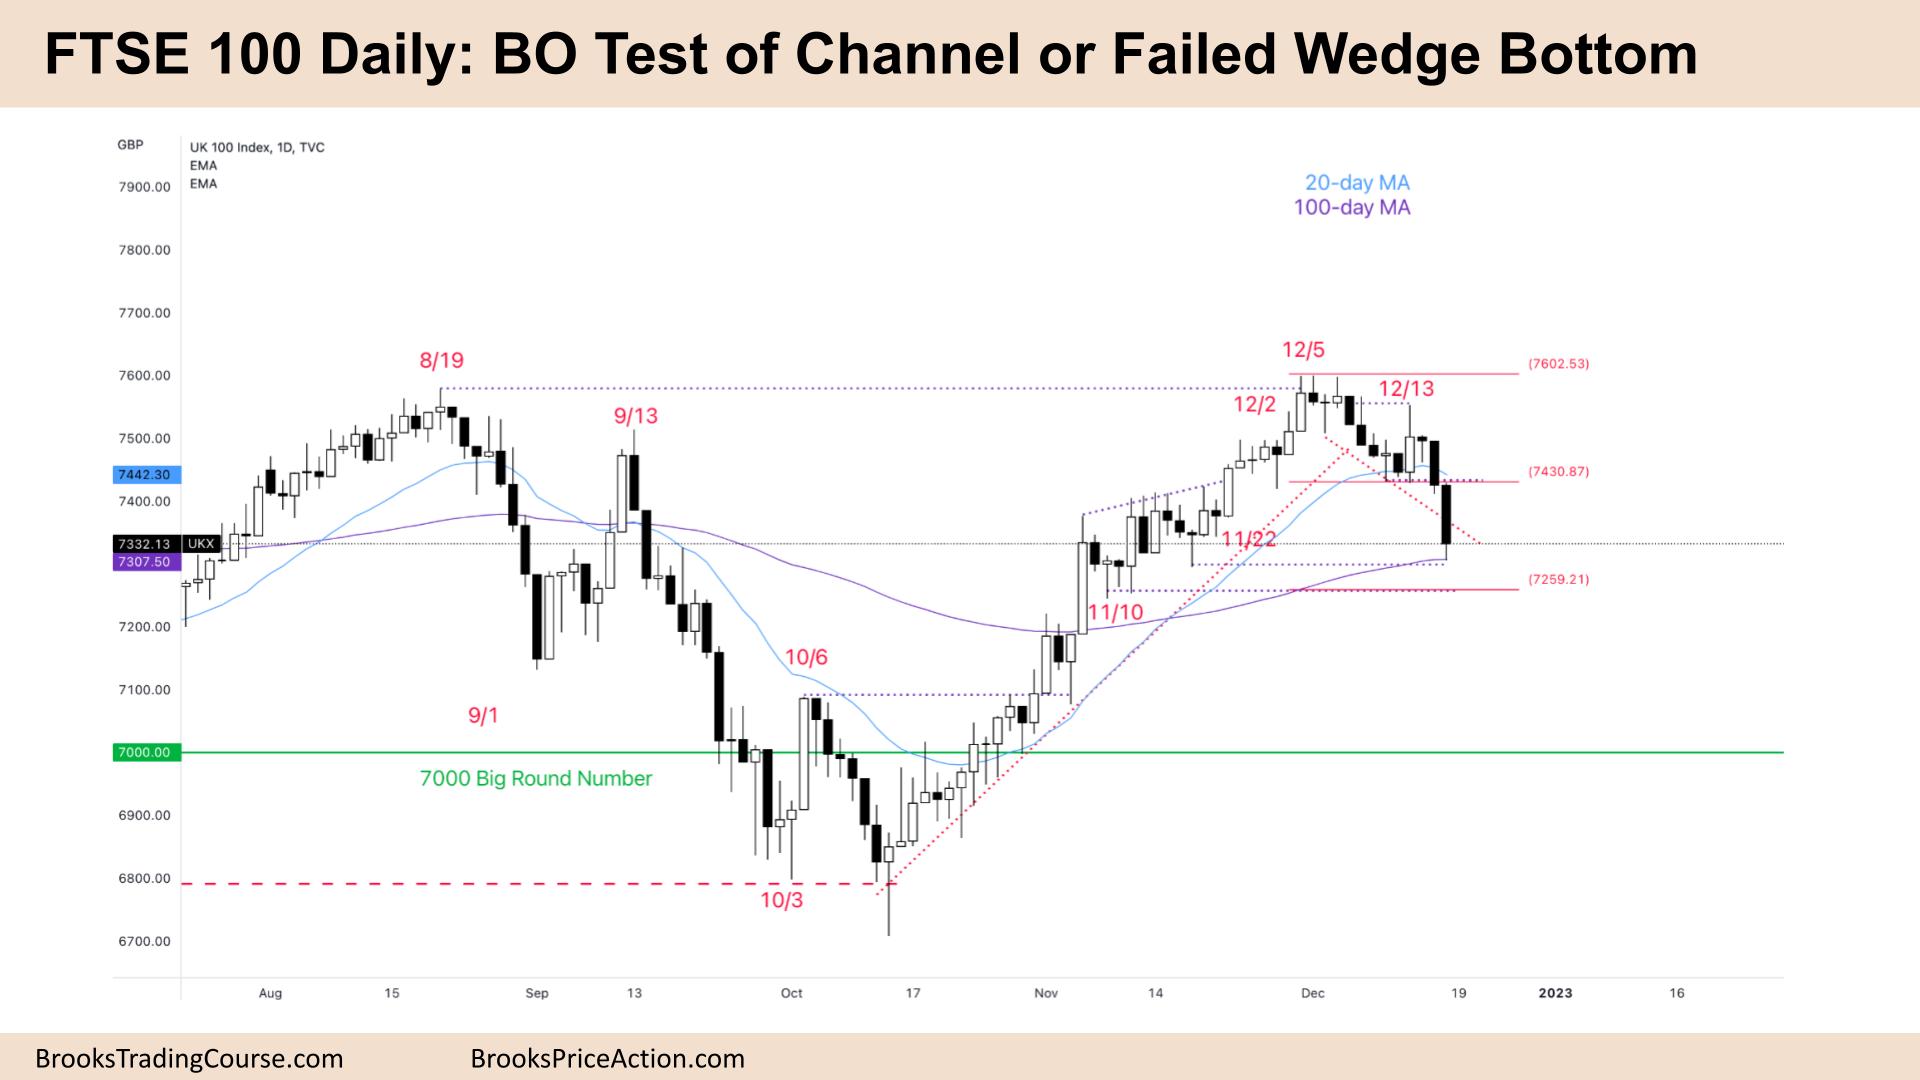
The Daily FTSE chart

- The FTSE 100 futures was a bear bar closing on its low, so we might gap down on Monday.
- It is the second consecutive bear bar – both big and both are closing on their lows, so we are always in short closing just above the 100-day moving average.
- The bulls see a small pullback bull trend from the low to the high of a trading range. Traders expected two legs sideways to down.
- It was more than 20 bars above the moving average, so traders expected to reach it and find buyers. But now we are breaking below.
- There was a double top on Dec 5th, a bad sell signal, so once we hit the moving average, we tested that breakout point and continued down for another leg.
- The bears see a bigger double top with August 19th. It was a second entry short signal after the bear bar on Dec 6th. Most bears sold below that or waited for one more bar.
- The bulls want a spike and channel test down to the Nov 11th or Nov 22nd low. They have open gaps around here, so it is reasonable to test these swing points in a trading range.
- The bears might see a failed wedge bottom bull flag, with Friday breaking below. They would want a further measured move based on the measuring gap putting it down at that channel test.
- Trading ranges are full of disappointment, so we might do none of the above. Monday could reverse, creating a sell climax and trapping bears into a bad short. Bulls can get a second entry-long signal with Dec 13th.
- Small pullback bull trends are likely to convert into trading ranges first.
- Most traders should be short or flat
Market analysis reports archive
You can access all weekend reports on the Market Analysis page.

