Market Overview: FTSE 100 Futures
The FTSE futures market was a possible FTSE 100 buy climax at the trading range highs. We have gone sideways at this price for several years, so we are unlikely to go much higher without coming back down. Traders will be doing the opposite – selling good bull bars and buying good bear bars. There is an unknown number of traders stuck at the highs, so we will know next month if we get a new yearly high.
FTSE 100 Futures
The Monthly FTSE chart

- The FTSE 100 futures was a big bull bar closing on its high last month.
- It is the second consecutive bull bar closing on its highs, so we are always in long.
- It is the strongest bar in the trend, so it is a candidate for a buy climax.
- It is a buy signal but high in a trading range, is at best a 50% probability trade.
- The bulls see the market structure as a bull spike and channel, and we tested the low of the channel twice now and reversed up.
- The bears see a double top, a bear spike during COVID and a test of the breakout point.
- Stop-entry bulls are making money in this trend, while only a few stop-entry bears did. That tells you that we are more bullish than bearish.
- This year limit-order bears have been making money selling above bars, but most would not have sold above October as it was a second-entry buy setup. We should expect them to sell above November.
- The bulls want a follow-through bar to break above February, which was the Post-COVID high. That is a major swing high. In a trading range, major swing highs and lows get tested, so we prob need to get a little higher before turning down.
- The bears want a decent sell signal, which they probably won’t get in a trading range. More likely, a weak bull bar will be sold.
- If the bears can get a sell signal on the monthly, it could be the second entry short for a move back down, but currently always in long, so better to be long or flat.
- Probability is to the long side, but risk/reward is bad, so some bulls want a retracement, maybe 50%, to get long. Any trapped bears might get a chance to get out back in 50% of the range.
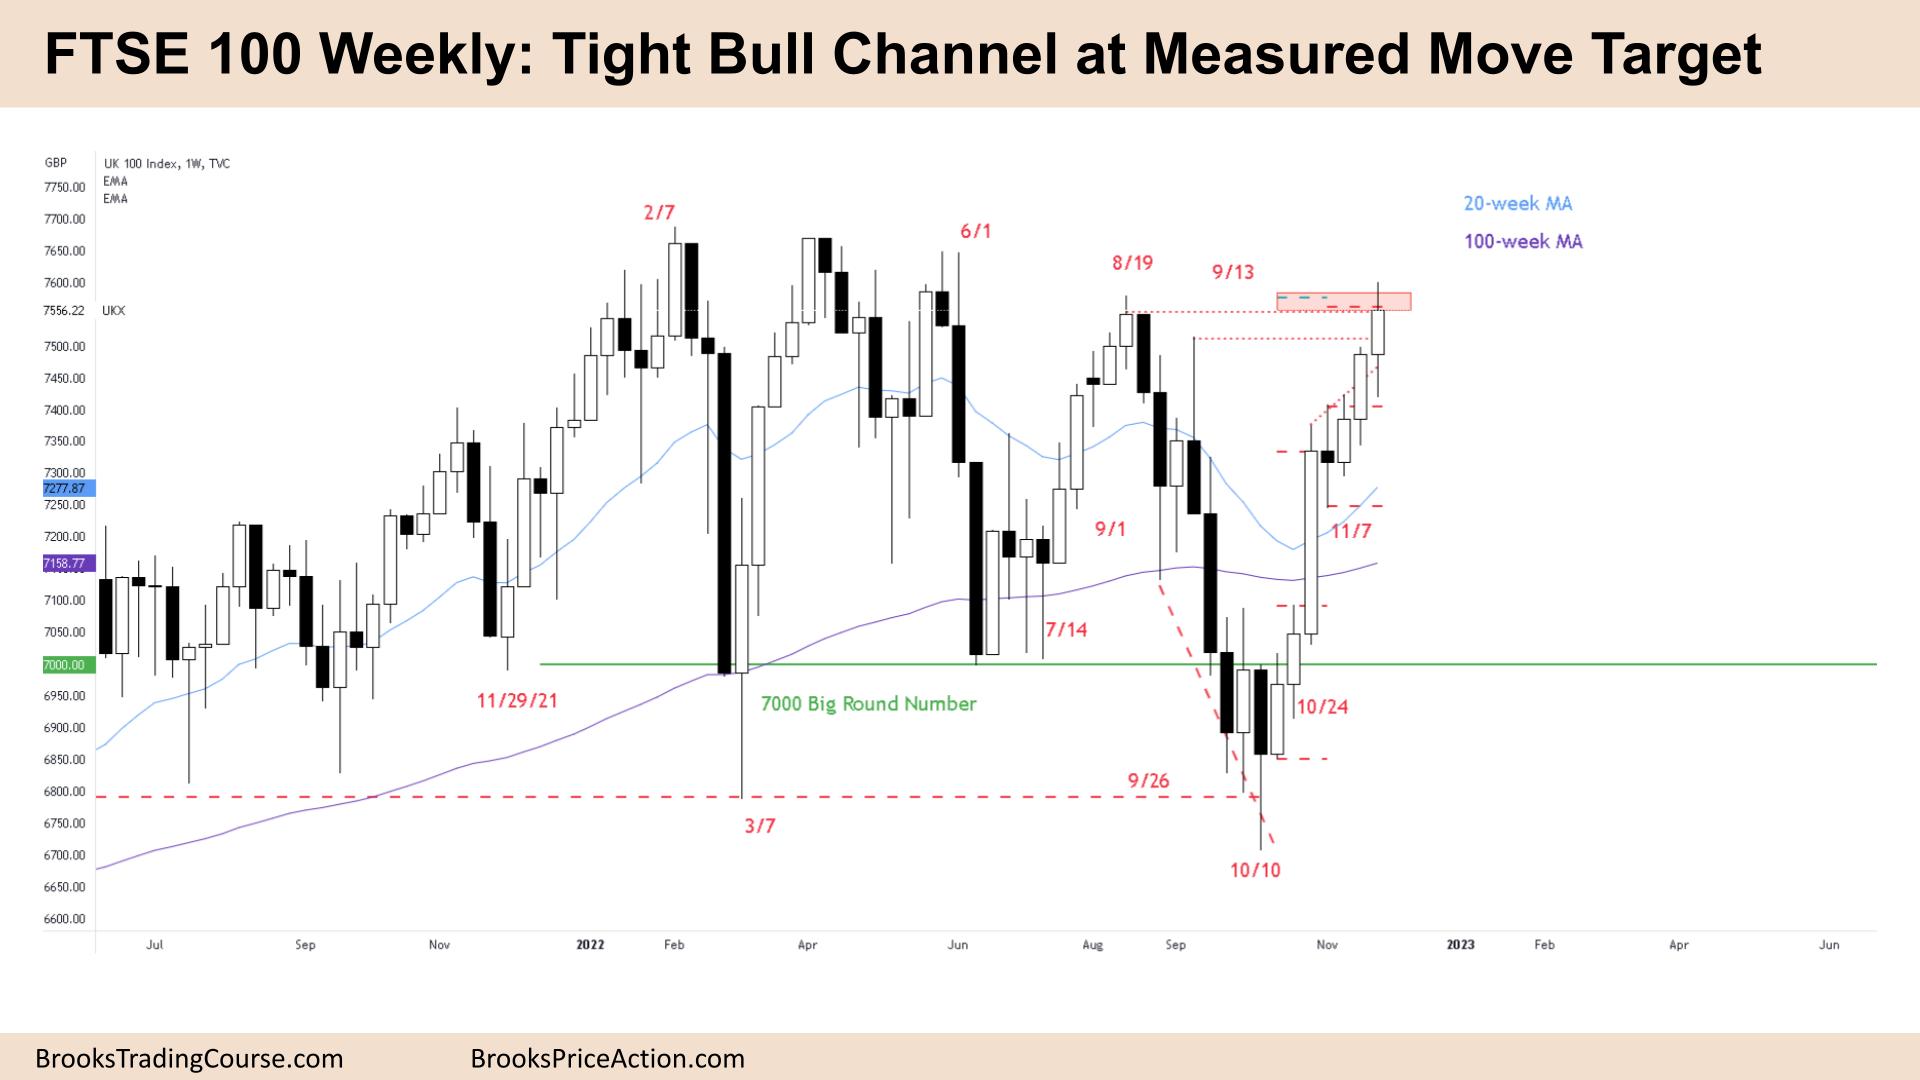
The Weekly FTSE chart

- The FTSE 100 futures was a bull bar with big tails above and below, so it is a pause bar.
- It is also a possible buy climax on the higher timeframe.
- It is the third consecutive bull bar closing above its midpoint, so we are always in long.
- It is also an 8-bar tight bull micro channel, so traders will expect the first reversal to be minor. Bulls will buy below the lows of a prior bar and back at the moving average far below.
- Bulls see a lower low major trend reversal. A double bottom low in a several-year trend. It was a moving average gap buy on the 100-week chart and a reasonable pullback to buy.
- So what’s the problem? There are 5 tops in this area. And each top has trapped traders who took a reasonable buy signal but were probably unable to exit without a loss.
- Bears see a lower high in a trading range and perhaps the start of a bear trend or broad bear channel. They will look to sell above bars and scale in higher.
- We are also at two measured move targets – a 1:1 and a 2:1 swing target. So profit-taking is likely next week.
- It is a bull bar, so it is a bad sell signal. The probability is we are going a little bit higher.
- The bulls want a pullback and a High 2 to get a second leg out of this range. The bears want an excellent sell signal for a low probability, but a good risk/reward swing down.
- Both are likely to be disappointed in a trading range. Bulls might exit quickly below the lows, or the Low 1 buy fails. Bears sell low, and we whipsaw in a trading range here.
- Better to be long or flat. Bears can sell new highs with a wide stop. Bulls can buy lows but are ready to exit quickly.
Market analysis reports archive
You can access all weekend reports on the Market Analysis page.

