*A new market analysis report — Let us know what you think below
Market Overview: European Market Analysis
The FTSE futures market failed to get follow-through selling from the largest bear bar since the COVID crash. Traders are looking to see if the bears can get a second leg down or whether the pause here is an overdue pullback in a longer bull channel. This confusion may give us sideways to down trading next week while traders decide.
FTSE 100 Futures
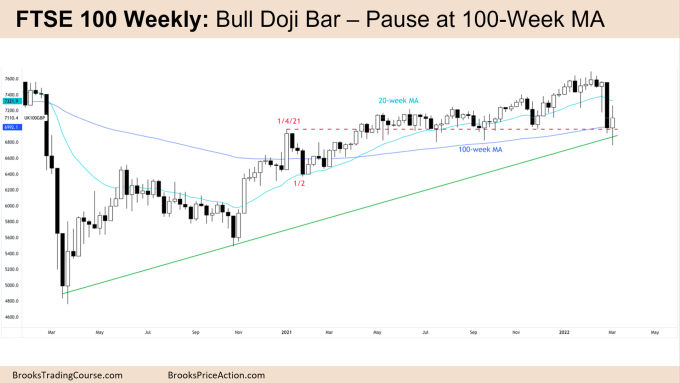
The Weekly FTSE chart

- This week’s FTSE candlestick was a bull doji bar closing at its midpoint with large tails above and below.
- Although it traded lower than last week’s large bear surprise bar, it was weak follow-through selling after the largest pullback in a 16-month bull trend.
- Both this week and last week’s bar have tails on the bottom which suggest it is not as bearish as it could be.
- The bears see it as a pause before a second leg down. Though we might need to go sideways to up first.
- The bulls see it as the bottom of a 12-month trading range, the top of a breakout from 2021 and previous tight trading range which was a magnet and reasonable place for bears to exit.
- The bulls might also see it as the deepest pullback in a much longer bull trend from the COVID crash.
- Either way the bears have struggled to get follow-through selling on the weekly chart for more than 3 consecutive weeks since the COVID crash – and this week was no different.
- The bears know we failed to breakout from the pre-COVID resistance above which improves their probability to scale into shorts above this week’s bar. They need a strong close next week to convince trailers we are going lower.
- This week was also the first moving average gap bar in over 3 months which is a reasonable buy setup in a trend. The bulls have bought each time this has happened in the prior 12 months.
- If the bulls take that signal above 7250 it might suggest the bottom of the trading range is holding with a view to test the high at 7700.
- The bears will need to print another week below the moving averages to convince traders we will get a second push down. Hoping on a measured move target to 6400
- Because last week was a doji there is a lack of commitment which is the hallmark of a trading range. Traders will likely BLSHS (Buy low sell high scalp.)
- Bulls want to trade higher next week and trigger a High 1 buy signal but will need strong follow through buying to get there. A high 1 buy in the middle of a trading range is not a strong signal so they will likely use a wide stop and scale in lower at a possible double bottom.
- If we do go much higher in the next week or two, we can expect sellers around the moving average looking for a possible low 1 sell, possible second leg down to 6800.
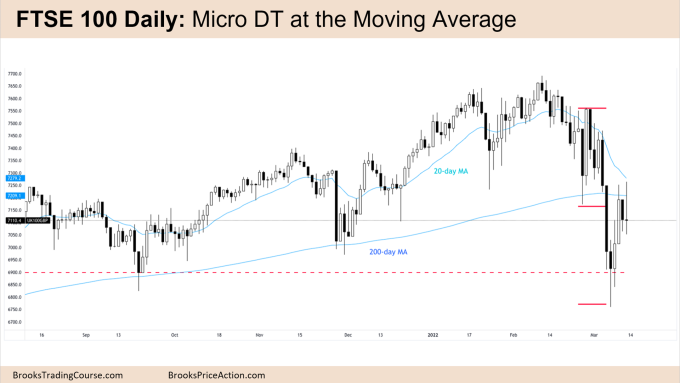
The Daily FTSE chart

- Friday’s candlestick on the daily FTSE chart was a bear doji with long tails. It was a possible failed low 1 at the moving average.
- Wednesday and Friday was a possible micro double top and Thursday and Friday printed an inside-outside breakout mode pattern for next week.
- Although Monday continued last week’s selling pressure, it finished at a measured move break of an expanding triangle from last week and then reversed higher.
- The bears see it as a pullback in a weak bear channel and a high probability sell if we reject the moving average again or if we trade lower for another leg and test of 6800. 6800 is a reasonable exit as it has been support in a 6-month trading range.
- That would also be a possible double bottom at the bottom of the trading range and reasonable buy setup for a test of the highs.
- Bears want to convince traders that was the spike for a longer bear trend but were unable to get strong closes this week.
- The bulls see Friday’s failed low 1 and want a second leg up past the moving average. They see the spike down as a sell climax.
- Because we are sitting in a 12-month trading range, both bulls and bears are likely to be disappointed.
- We will likely see sellers above at the moving average and buyers below betting on a trading range. So the result is probably sideways to down.
- Bears would need a strong close, which they might get closer up to around 7300 to convince traders we will go down further.
- March and April are often the most bullish months of the year. So if we do see a second leg down it might end at 6800 creating a double bottom buy signal. That will help convince traders we have seen the low for many months, possibly even the rest of the year.
Weekly Reports Archive
You can access all weekly reports on the Market Analysis page.

