Market Overview: EURUSD Forex
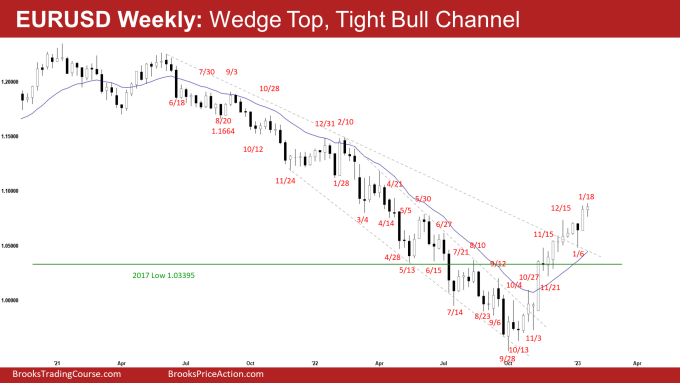
The EURUSD Forex was a small bull doji on the weekly chart. Bulls want an endless small pullback higher. If there is a pullback, they want the pullback to be sideways and shallow. The bears want a reversal lower from a wedge top.
EURUSD Forex market
The Weekly EURUSD chart

- This week’s candlestick on the weekly EURUSD Forex chart was a small bull doji.
- Last week, we said that the odds slightly favor the EURUSD to trade at least a little higher.
- This week traded above last week’s high but closed below it. It was a weak breakout and follow-through candlestick.
- The bulls got a strong spike and channel up and hope that the market is now Always In Long.
- They want an endless small pullback bull trend up.
- Since the September low, the bulls have created bigger bull bodies with closes near their highs with follow-through buying, while the bear bars are weak with no follow-through selling. That means strong bulls.
- The strong move up increases the odds of at least a small second leg sideways to up after a deeper pullback.
- The bulls want any pullback to be sideways and not deep. If the pullback is weak and sideways, the odds of another strong leg-up increase.
- The bears want a 2-legged sideways-to-down pullback lasting at least a few weeks.
- However, they have not yet been able to create credible selling pressure with strong bear bars and follow-through selling.
- They hope to get a reversal lower from a double-top bear flag (with May/Jun 2022 high) and a wedge top (Nov 15, Dec 5 and Jan 18).
- Because of the strong move-up, they will need a strong reversal bar or at least a micro double top before traders would be willing to sell aggressively.
- If next week trades higher, they want it to form a micro double top with January 18 high or a reversal bar.
- Since this week was a bull doji, it is a neutral signal bar for next week.
- While odds slightly favor the EURUSD to trade sideways to up, the rally since October has lasted a long time and is climactic.
- The wedge pattern increases the odds that we will see at least a small pullback which can begin at any moment.
- For now, the bears are still weak and need to do more to convince traders of a pullback or a reversal.
- The levels around 1.080 are resistances (20-month exponential moving average – not shown on chart).
- Traders will see if the bulls can break far above it or if the EURUSD trades higher but stalls and reverses lower, starting the pullback phase.
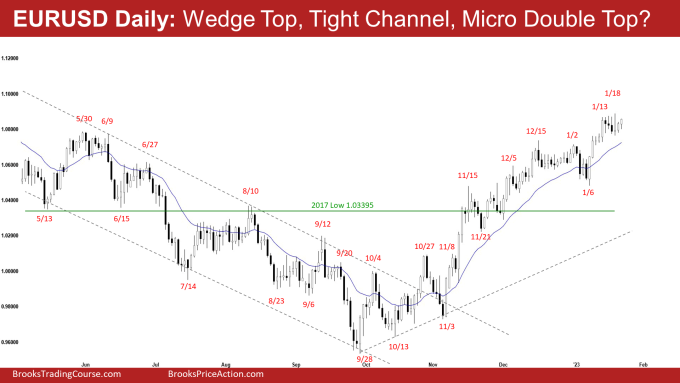
The Daily EURUSD chart

- The EURUSD was mostly sideways around the 1.080 level this week.
- Last week, we said that the tight channel up and weak selling pressure continue to slightly favor the EURUSD to trade at least a little higher.
- While this week traded above last week’s high, the bulls were not able to get sustained follow-through buying.
- The bears see the move up since October as a 50% pullback of the selloff which started in May 2021.
- They want a reversal lower from a double-top bear flag (May/June 2022 high) and a wedge top (Nov 15, Dec 15, and Jan 18).
- They see the move up from January 6 as a rally from a final flag (mid-Dec to the first week Jan) and wants the EURUSD to stall and reverse lower soon.
- Because of the strong move up, the bears will need a strong reversal bar, or at least a micro double top before they would be willing to sell aggressively.
- The bears need to create strong consecutive bear bars closing near their lows to increase the odds of lower prices.
- The spike & tight channel up since October means strong bulls.
- The bulls hope that the market has flipped into Always In Long.
- They want an endless small pullback higher. They want any pullback to be sideways and not deep.
- If they continue to get weak and shallow pullbacks, the odds of another strong leg up increase.
- If there is a deep pullback, the bulls want a reversal from a higher low major trend reversal and a larger second leg sideways to up.
- For now, the tight channel up and weak selling pressure continue to slightly favor the EURUSD to trade at least a little higher.
- However, the rally is climactic and lasted a long time.
- The wedge pattern also increases the odds of at least a small pullback which can begin at any moment.
- The bears need to do more to convince traders that a pullback is imminent.
- The levels around 1.080 (20-month exponential moving average – not shown on chart) remain as resistance.
Market analysis reports archive
You can access all weekend reports on the Market Analysis page.

