Market Overview: Weekend Market Analysis
The SP500 Emini futures had a failed breakout above the top of its 4-week trading range last week, and a failed breakout below this week. Consecutive outside bars on the weekly Globex chart. The strong reversal up this week makes a successful breakout above the range more likely than a breakout below. The bulls would then look for a 200-point measured move up to 4,400.
The EURUSD Forex market reversed down this week after last week’s reversal up. It has stalled for 4 weeks at the top of its 10-month trading range, and it will probably not break out of the range for at least a couple more months.
EURUSD Forex market
The EURUSD weekly chart
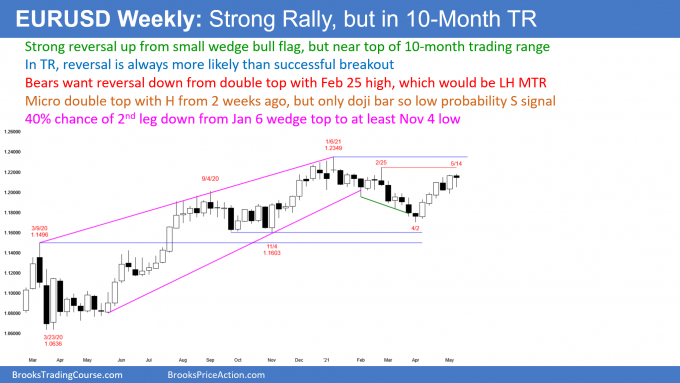
- Last week was a big bull bar that traded below the low of the prior week, and closed above its high. It was therefore an outside up week.
- This week traded above last week’s high and reversed down. It closed with a small bear body.
- This week is a micro double top with the bear bar from 2 weeks ago.
- The micro double top, the small bear body, the location (back in the December to February trading range), and the reversals in each of the past 3 weeks increase the chance of next week being a 5th sideways week.
- The 7-week bull channel is tight, so a reversal down will probably only last a week or two.
- Near the top of the 10-month trading range that began in August. Since most attempts to break out of a trading range fail, the current 2-month rally will probably continue to stall here.
- There is room to the top of the 10-month range, and the 7-week rally has been strong. The EURUSD might work a little higher over the next month, but the current leg up will probably not break above the January 6 top of the range.
- Traders will continue to look for reversals every 1- to 3-weeks.
S&P500 Emini futures
The Monthly Emini chart
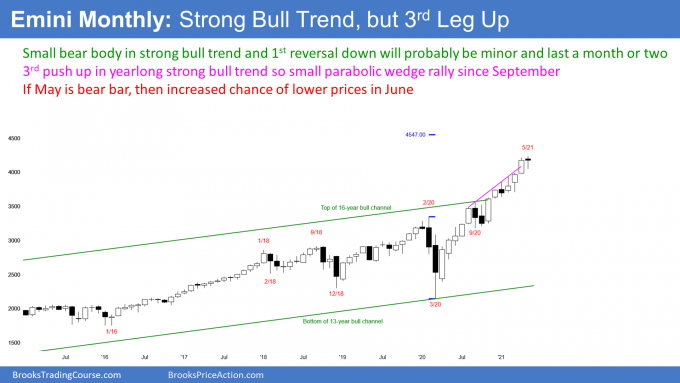
- Strong bull trend for more than a year. If May is another bull bar, traders will continue to look for higher prices.
- Small bear body so far in May. The bear body is the 3rd reversal down in the tight bull channel from the March 2020 low. If this month is a bear bar at the end of the month, there would then be a parabolic wedge top, which is a type of buy climax.
- Buy climaxes often attract profit takers. A big bear body in May would increase the chance of a pullback in June.
- A tight bull channel is a strong bull trend, and a sign that the bulls are eager to buy.
- The parabolic wedge top only has a 30% chance of immediately reversing into a bear trend, without first transitioning into a trading range.
- Bulls therefore should buy the 1st 2- to 3-month selloff. That limits the downside risk over the next several months.
The Weekly S&P500 Emini futures chart
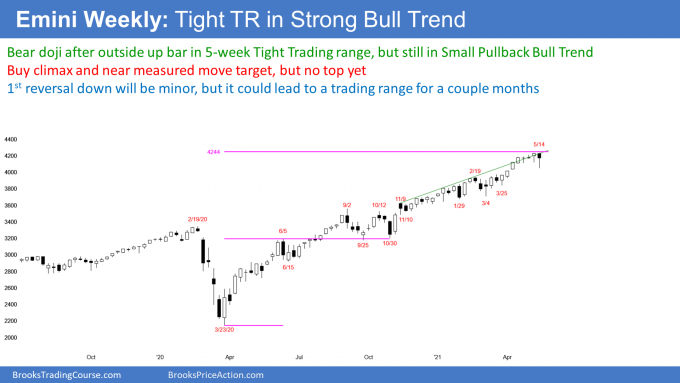
- This week was a big bar, and it broke below last week’s low and the bottom of the 4-week tight trading range.
- It closed far above last week’s low, and it is therefore not a good candidate for the start of a correction.
- However, because it had a small bear body, it is a weak High 1 pullback buy signal bar for next week. There might be more sellers than buyers above its high.
- Small Pullback Bull Trends, like the past year, rarely last more than 60 bars before transitioning into a trading range. There is currently a 60% chance that the weekly chart will evolve into a trading range this summer.
- The conversion requires a reversal. When a buy climax reverses, the correction usually lasts longer and falls deeper than any earlier correction in the trend.
- The biggest correction during this rally was the 10% selloff in September and October.
- Therefore, once a correction begins, the selloff should be more than 10%, and last more than a couple months.
- Institutions say that a 10% selloff is a correction, and a 20% selloff is a bear market.
- There is a 40% chance that once there is a correction, it will continue down to 20%.
- It is important to note that there is no top yet. Traders continue to buy, expecting at least slightly higher prices.
Weekly Globex chart has OO setup
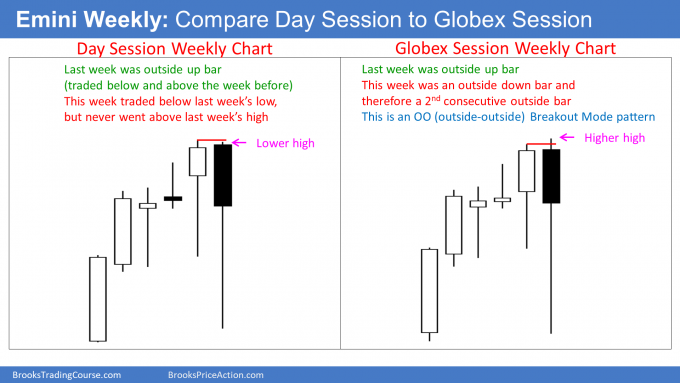
- On the weekly Globex chart (chart on right) this week’s high was above last week’s high, and this week’s low was below last week’s low. It therefore is an outside bar.
- The week before was an outside up bar.
- Consecutive outside bars is an OO pattern (outside-outside). It is a Breakout Mode pattern.
- Traders will theoretically look to sell below this week’s low, and buy above this week’s high. This is true even if the breakout comes several weeks from now.
- Many traders will not actually sell below or buy above, because the bar is big, and therefore the risk is big.
- However, once either signal triggers, traders will tend to look for trades in that direction on the daily and 60-minute charts.
- If one signal triggers but the Emini then reverses and triggers the opposite signal, some traders will reverse.
- The day session weekly chart (on the left) is almost an OO pattern. The more a market does something that resembles a pattern, the more it will behave as if the pattern actually formed.
- I am showing the weekly Globex chart to illustrate the OO pattern. Traders can see that the day session’s weekly chart is very similar.
- Therefore, traders will be bearish if there is a breakout below this week’s low.
- Also, they will be bullish if there is a breakout above this week’s high on the weekly Globex chart, or the high of 2 weeks ago on the weekly chart of the day (which is slightly above this week’s high).
- Finally, a breakout of a Breakout Mode Pattern has about a 50% chance of failing and then reversing. Therefore, traders will watch for a possible reversal trade after the breakout.
The Daily S&P500 Emini futures chart
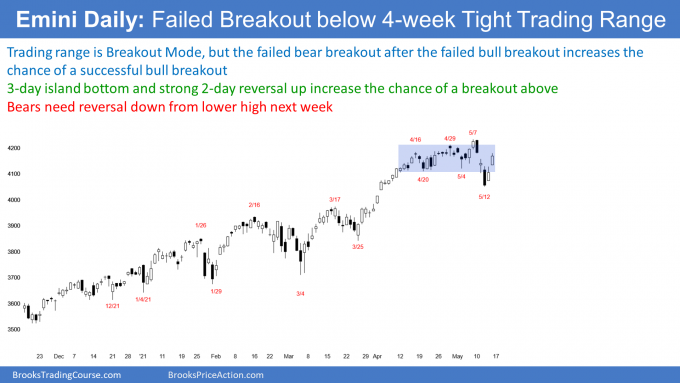
- Last Friday broke above the 4-week trading range, but the breakout failed.
- This week broke below the bottom of the range, and the bear breakout failed as well.
- A failed bear breakout after a failed bull breakout increases the chance a successful bull breakout.
- Remember the OO on the weekly chart. It is simply a reflection of the repeated reversals on the daily chart.
- If the daily chart breaks above the trading range, which is now more likely than not, the breakout would trigger an OO buy signal on the weekly chart.
- Traders would then look for a 200-point measured move up to above 4,400 instead of a 200-point measured move down.
- Even though the daily and weekly charts are in Breakout Mode, which is approximately a 50-50 market, this week’s strong reversal up from a failed bear breakout makes a bull breakout more likely.
Trading Room
Traders can see the end of the day bar-by-bar price action report by signing up for free at BrooksPriceAction.com. I talk about the detailed Emini price action real-time throughout the day in the BrooksPriceAction.com trading room. We offer a 2 day free trial.
Charts use Pacific Time
When I mention time, it is USA Pacific Time (the Emini day session opens at 6:30 am PT, and closes at 1:15 pm PT). You can read background information on the intraday market reports on the Market Update page.

