Monthly S&P500 Emini futures candlestick chart: Buy climax, but not yet high probability trading for the bears
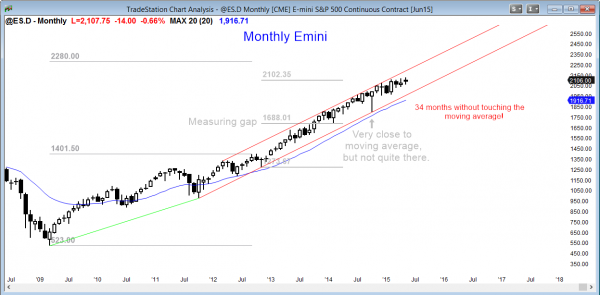
The monthly S&P500 Emini futures candlestick chart is in a small pullback bull trend, but the past 7 weeks have been essentially in a tight trading range that is sloped upward.
The monthly S&P500 Emini futures candlestick chart is extremely overbought. Monday will be the start of the 35th consecutive month without touching the 20 month exponential moving average.
The S&P cash index has only been above this average for more than 30 consecutive months two other times in the past 50 years. The last time was in 1998 when it stayed above for 44 months before correcting 22%. However, that was at the start of a bull trend, and the current rally is late in a bull trend. It is therefore unlikely to be as strong. The other time was the 1987 Crash. That was late in a bull trend, like today, and it stayed above the average for 38 months before correcting 36%. However, there is no sign of a top and the current rally could continue much longer, but each bar gets closer to the start of the correction.
Since the moving average is about 200 points below the high, the correction will probably be about 10% when it comes. It might go down to the October low.
Weekly S&P500 Emini futures candlestick chart: Candlestick pattern is a Final Bull Flag reversal
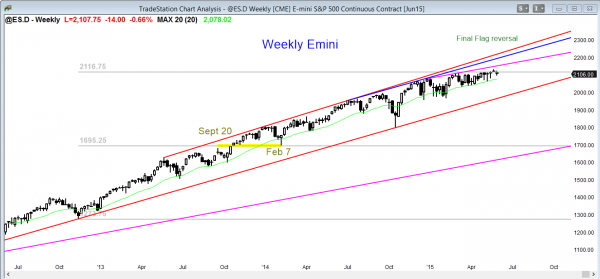
The weekly S&P500 Emini futures candlestick chart is reversing down after a weak breakout above a tight trading range. The reversal down is also weak, and the tight trading range might simply be growing.
The weekly S&P500 Emini futures candlestick chart has been trying to break above its tight trading range for 5 weeks, but has continued to fail. This week was another entry bar for the bears in this candlestick pattern. Last week’s signal bar had a bull body and this week’s entry bar is small. This reversal might be simply adding more bars to the tight trading range instead of beginning a swing down. Until there is a strong bear breakout, the bull trend is still intact. Once there is a bear breakout, traders will see this tight trading range as the Final Bull Flag.
Daily S&P500 Emini futures candlestick chart: Learn how to trade a wedge top
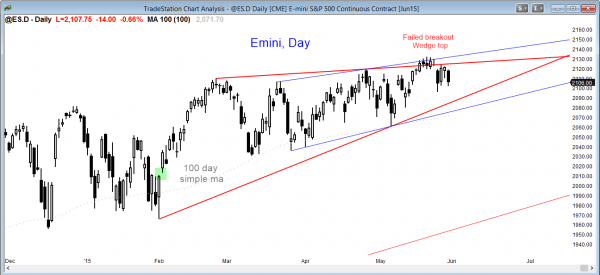
The daily S&P500 Emini futures candlestick chart is in a broad bull channel, and it is reversing down from the top of the channel, as it has done many times before.
The daily S&P500 Emini futures candlestick chart had a wedge top this month, and it turned down from a small lower high today. However, the Emini is still in a broad bull channel, and it is failing to have follow-through after either strong bull or bear days. This is typical of trading range and broad channel price action. Until there is a strong bear breakout, the bull trend is intact. It is possible that the bulls might get a strong bull breakout, but a bull breakout above a channel, especially late in a trend, fails 75% of the time. This means that the odds favor a bear breakout, whether or not a bull breakout comes first. Until there is a bear breakout, there is no breakout, and the bull trend is intact.
June has a strong tendency to rally from June 26 to July 5. This is in part due to portfolio managers making sure to buy the best performers of the quarter to show them on their books at the end of the quarter (window dressing). It also might be due to holiday and summer vacation euphoria. The implication of a rally at the end of the month is that there can be a sideways to down move in the middle of the month. With the S&P Emini futures contract as overbought as it is, traders have to be ready for a bear breakout WITH FOLLOW-THROUGH!
There have been many bear breakouts over the past 6 months. What they all have in common is the absence of follow-through. This is expected in a bull trend. If the daily chart falls 200 points, it will be in a bear trend, and the pattern of bad follow-through after big bear days will stop. There will be several consecutive big bear days, no matter how oversold the 5 and 60 minute charts may become. Traders learning how to trade the markets must be flexible, and not deny the change once it comes.
Traders can see the end of the day bar-by-bar price action report by signing up for free at BrooksPriceAction.com. I talk about the detailed Emini price action real-time throughout the day in the BrooksPriceAction.com trading room, and a 2 day free trial is available.
When I mention time, it is USA Pacific Standard Time (the Emini day session opens at 6:30 am PST, and closes at 1:15 pm PST). You can read background information on the intraday market reports on the Intraday Market Update page.


