Monthly S&P500 Emini candle chart: Strong bull trend, but overbought
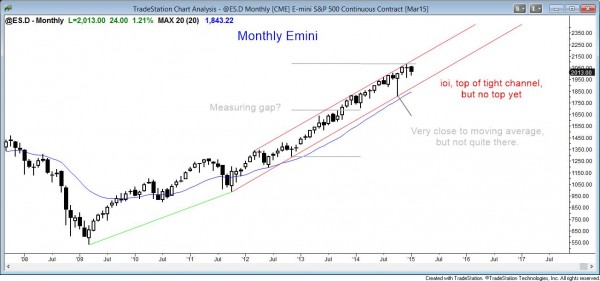
The monthly Emini chart is forming an ioi breakout mode setup at the top of the bull channel, but in a very overbought bull trend.
The monthly S&P500 Emini candle chart is still in a bull trend, but it is extremely overbought by at least one measure. I have written about this many times. The S&P500 monthly chart has not touched the 20 month exponential moving average in 31 months. This has happened only twice in the past 50 years, and both prior times were followed by at least a 20% correction.
Although the Emini can rally many more months before the likely correction begins, the current 31 month breakout above the moving average is forming very late in a bull trend. This makes it more likely that the correction will begin sometime this year. Has it already begun? Everyone is wondering the same thing. However, the monthly chart is still strongly bullish and the evidence for the correction is not present yet.
Will the selloff be big enough to turn the monthly chart into a bear trend? Probably not. Most bull trends are followed by trading ranges, not bear trends. Once in a trading range, the bears can create enough selling pressure to reverse the Emini into a bear trend. The selling pressure would create a pattern, like a major trend reversal, a wedge top, or a final flag top. Less likely, there can be a strong bear breakout with strong follow-through at any time, but this has not begun yet.
This month is creating an ioi pattern, which is a small breakout mode setup. This month’s range is inside last month’s, and last month’s was outside of the range of the prior month. So, 2 months ago was inside, last month was outside, and this month so far is inside. If this remains, it is a 2nd entry sell setup next month. Bears will consider shorting one tick below this month’s low, and bulls will consider buying one tick above this month’s high. Since the Emini is at the top of a channel, the probability for a profitable bull breakout is less than that for a profitable bear breakout. Since an ioi pattern is a 3 bar tight trading range, the probability that either breakout will go far is less than 50%. More likely, the Emini would continue sideways more.
Weekly S&P500 Emini candle chart: Reversing up from the moving average, but weak signal bar
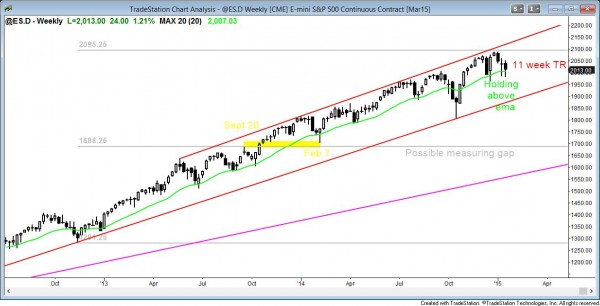
The weekly Emini candle chart has a micro double bottom with closes above the moving average. It is forming a double bottom (high 2) bull flag with the low of 4 weeks ago, but the bear body and tight trading range price action make this a weak buy setup.
The weekly S&P500 Emini candle chart is still in a bull trend, and it is continuing to get closes above the 20 week ema. However, this week’s candle has a bear body and the close is in the middle of the candle, and not near the top. This follows last week’s doji and the prior week’s bear trend bar. This is a loss of momentum by the bulls. The trend is still up, but there is enough selling pressure within this 11 week trading range for a credible bear breakout to happen at any time.
At the moment, this week’s candle is a buy signal bar for next week. It is forming a micro double bottom with last week, and the closes for both weeks are above the moving average. It is also a double bottom with the January 6 low, which makes it a high 2 buy setup (a sideways ABC pullback in a bull trend). The bear body lowers the probability of a profitable buy to below 50%, but it is still a reasonable buy setup for a swing up since the potential reward is much more than the risk.
Since the Emini is now in a relatively tight trading range, it is more of a limit order market at the moment. More traders will look to sell bull breakouts than buy them, and more will buy bear breakouts than sell them. Traders will also be quick to take profits. When traders are buying low, selling high, and scalping, a trading range usually forms. This range is 11 weeks old and there is no sign of a top yet. Every bar that gets added to the range reduces the chances that the bull trend will continue. Since it is still a bull trend, the odds favor the bulls, but they are getting close to 50%.
Daily S&P500 Emini candle chart: Bull flag on the daily chart
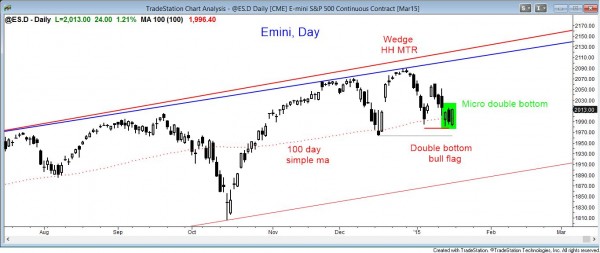
The Emini daily candle chart is turning up from the 100 day moving average and has a 2nd entry buy setup (a micro double bottom with the low of 2 days ago). It is also forming a double bottom with the low of two weeks ago. Since the double bottom is a higher low (above the December low), it is a double bottom bull flag.
The daily S&P500 Emini candle chart formed a micro double bottom over the past 3 days. This creates a 2nd entry buy signal next week. It is forming at the 100 day moving average and it is a high low compared to the December 16 low. There is also a double bottom with the January 6 low. A double bottom in a bull trend is a double bottom bull flag. The bulls want a breakout above the neckline, which is the January 9 high, and then a measured move up to a new all-time high. The bears do not mind if the Emini bounces here, but they want a bear breakout below the double bottom, and then a measured move down to the October low.
Today was a strong bull reversal within a bull trend at support, and it formed a higher low. This makes today a buy signal bar for next week. However, the daily chart has been in a trading range for 3 months, and until there is a breakout with follow-through in either direction, traders will continue to take quick profits.
The daily chart is still in a broad bull channel. Depending on one’s definition, the channel started in October or many months before then. There is enough selling pressure for a bear breakout to develop at any time. In particular, when there is an obvious buy setup, like we currently have, and it is turning up from critical support, traders always have to be open to the exact opposite happening. For example, if the Emini gaps down strongly when the market opens on Tuesday, traders cannot be in denial. They have to accept it as a strong statement that the market wants to go down, and they should be prepared to swing trade their shorts.
Traders can see the end of the day bar-by-bar price action report by signing up for free at BrooksPriceAction.com. I talk about the detailed Emini price action real-time throughout the day in the BrooksPriceAction.com trading room, and a 2 day free trial is available.
When I mention time, it is USA Pacific Standard Time (the Emini day session opens at 6:30 am PST, and closes at 1:15 pm PST). You can read background information on the intraday market reports on the Intraday Market Update page.


