Monthly S&P500 Emini candle chart: Bull breakout but the bull trend is overbought
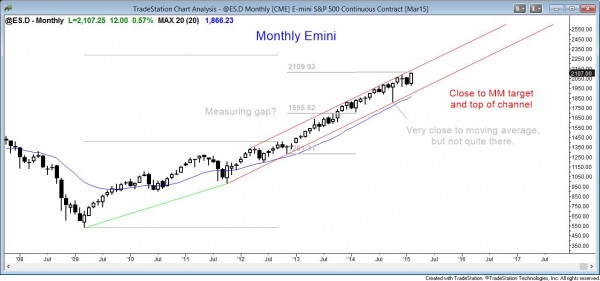
The monthly Emini candle chart is in a tight bull trend channel, just below a measured move target and the top of the trend channel.
The monthly S&P500 Emini candle chart has an outside up month in a tight bull trend channel. This is a bull breakout but the bull trend is overbought. This is the 32nd month without touching the moving average, and this is unsustainable and therefore a buy climax. Although there will probably be a 20% correction this year, there is no sign of a top yet. Because the monthly chart is so unusually overbought, a sharp reversal down can happen at anytime. Once traders start to sell, all of the bulls who bought over the past few months will be holding losing positions. As they sell out, the bear momentum can increase quickly. This can turn a strong bull trend into a bear swing within just a few bars.
Traders learning how to trade the markets should wait until there is a clear and strong reversal down before shorting. Even though the Emini is exceptionally overbought, the bulls are still in control.
There is a measured move target around 2110, just above today’s high. Although this might lead to some brief profit taking, the bears need to do much more before they will be willing to swing trade their shorts.
The top of the trend channel is around 2040, and the Emini will probably test there within a month or two. Traders learning how to trade the markets need to wait for a credible reversal before looking to short. Until then, bulls remain in control.
Weekly S&P500 Emini candle chart: Strong bull breakout, but just below measured move target and top of the bull trend channel
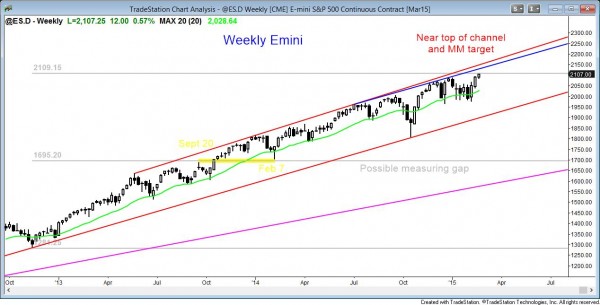
The weekly Emini candle chart is breaking out strongly from a bull flag, but it is just below a measured move target and the top of the bull trend channel.
The weekly S&P500 Emini candle chart us breaking above a bull flag. There is a measured move target at 2109 based on the measuring gap below the February 7, 2014 low. The tops of the bull trend channel are between 2130 and 2150, and that is a magnet area as well.
Bears are hoping that this breakout of the bull flag reverses down soon. That would make the January flag the final bull flag. If the bear trend reversal happens, traders will short, looking for 2 legs and 10 bars sideways to down. In the meantime, the breakout is strong enough so that the first pullback will probably be bought. The bears need either a second entry short or a strong bear breakout, and there is no sign of either yet.
Daily S&P500 Emini candle chart: Strong bull breakout, but 8th consecutive bull trend day, so buy climax
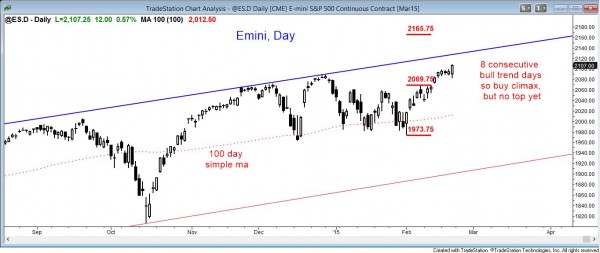
The daily Emini candle chart is breaking out strongly, but is overbought.
The daily S&P500 Emini candle chart broke strongly to the upside today, but this is the 8th consecutive bull trend candle, which is unsustainable and therefore climactic. Although a bear trend day is likely Monday or Tuesday, the odds are that the current move up is so strong that the first attempt at a bear trend reversal will probably be bought. The top of the channel is around 2130 and the Emini might have to test there before it can correct more than 2%.
Bulls are hoping that last week’s gap up becomes a measuring gap. Bears want it to be an exhaustion gap. If there is a gap down next week, the Emini will have an island top. Although many bear trends begin with island tops, most island tops are followed by trading ranges and not opposite trends.
Traders can see the end of the day bar-by-bar price action report by signing up for free at BrooksPriceAction.com. I talk about the detailed Emini price action real-time throughout the day in the BrooksPriceAction.com trading room, and a 2 day free trial is available.
When I mention time, it is USA Pacific Standard Time (the Emini day session opens at 6:30 am PST, and closes at 1:15 pm PST). You can read background information on the intraday market reports on the Intraday Market Update page.


