Monthly S&P500 Emini futures candlestick chart: Failed breakout above trading range
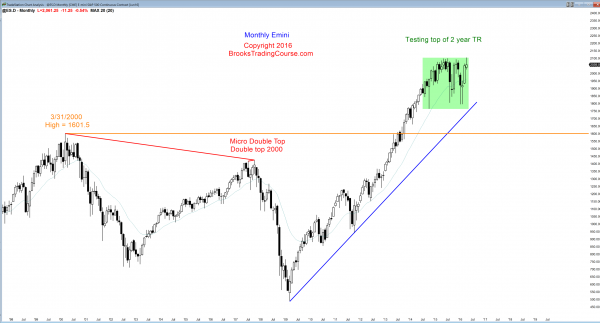
The bar on the monthly S&P500 Emini futures candlestick chart closed today. It was a reversal bar, but the bar had a bull body and it followed a big bull trend bar.
The bar on the monthly S&P500 Emini futures candlestick chart closed today, which was the last trading day of the week and of the month. The past 2 days of strong selling affected the appearance of the candlestick patterns on the weekly and monthly charts. They put a big tail on the top of the monthly bar, but it still had a bull body. The tail on top now makes it a sell signal bar for May. Since It is a reversal down from a breakout above the July all-time high, which is major resistance, the Emini might have to trade below the April low in May to trigger the sell to see if there are more buyers or sellers below. After such a strong 3-month rally and with a bull body, there will probably be buyers below April’s low and the reversal will likely become a bull flag.
There is still no strong breakout of the 2-year monthly trading range, so despite the strong 3 months up, the Emini is still within its range. The odds that any of these strong rallies or selloffs over the past 2 years will create a successful breakout are small. Even though eventually one will succeed, most trading range breakout attempts fail and trading ranges can grow to contain many bars.
Weekly S&P500 Emini futures candlestick chart: Learn how to trade a failed buy climax candlestick pattern
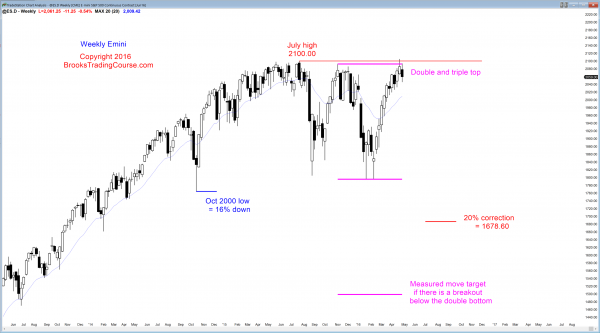
The weekly S&P500 Emini futures candlestick chart had its 1st pullback after an 11 week bull micro channel.
The weekly S&P500 Emini futures candlestick chart candlestick pattern was an 11 bar bull micro channel. Since there have only been 2 longer bull or bear micro channels in the past 10 years, and neither lasted more than 13 weeks, there was a 90% chance that there would be a pullback within the next couple of weeks. This week was the pullback once it traded below last week’s low.
While the 11 bar channel was climactic, it also represents strong bulls. The odds are that the pullback will only last 1 – 2 weeks before the bulls test the July high again. However, the bull trend resumption after a pullback from a climactic bull micro channel usually fails to go up very far. The Emini usually enters a trading range after a 2 – 3 bar rally. Therefore, although the downside is limited by the strength of the bulls, the upside is also probably limited, but by the exhaustion of the bulls. A trading range for the next few weeks is likely.
Daily S&P500 Emini futures candlestick chart: Pullback after Final Flag Top
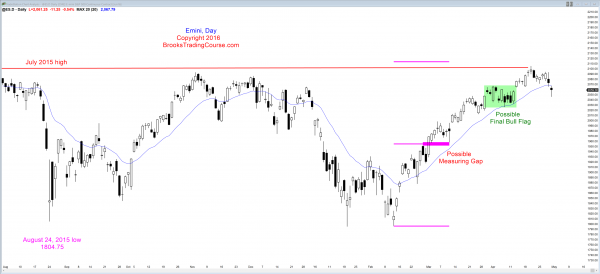
The daily S&P500 Emini futures candlestick chart had a 2 legged pullback from its test of the July all-time high.
Wednesday’s bull trend bar on the daily S&P500 Emini futures candlestick chart turned out to be a sell signal bar, but it had a bull body and therefore was weak. Thursday was the entry bar, but it had a big tail below and a close above the moving average. This was a weak entry bar. Friday was the follow-through bar and it reversed up to close near its open. This was weak follow-through selling. This makes it likely that this selloff is probably a bear leg in what will become a trading range rather than a bear trend.
Because of the weak selling, the Emini might bounce before testing the 2030 bottom of the Final Bull Flag. A trading range is more likely than a bear trend. Although the Emini is still in a bull trend, it also has been in a trading for over a month. There is no sign of a breakout up or down, and it is likely that the trading range will continue.
Traders can see the end of the day bar-by-bar price action report by signing up for free at BrooksPriceAction.com. I talk about the detailed Emini price action real-time throughout the day in the BrooksPriceAction.com trading room, and a 2 day free trial is available.
When I mention time, it is USA Pacific Standard Time (the Emini day session opens at 6:30 am PST, and closes at 1:15 pm PST). You can read background information on the intraday market reports on the Intraday Market Update page.


