Market Overview: Weekend Market Update
The Emini has rallied strongly for 4 weeks. The bulls are trying to reach the February close to erase the entire March selloff. The rally has a wedge shape, which means it is a buy climax. But traders will buy the 1st 2 – 4 week pullback.
The bond futures are at the apex of a triangle on the daily chart. There probably will be a test of the November low within a few months. This is true even if the bonds break above the triangle and test the March high 1st.
The EURUSD chart is at the apex of a diamond pattern. It will probably break out withing a few weeks. There is a 50% chance of the breakout being up or down.
30 year Treasury bond Futures market:
Trading range for remainder of the year
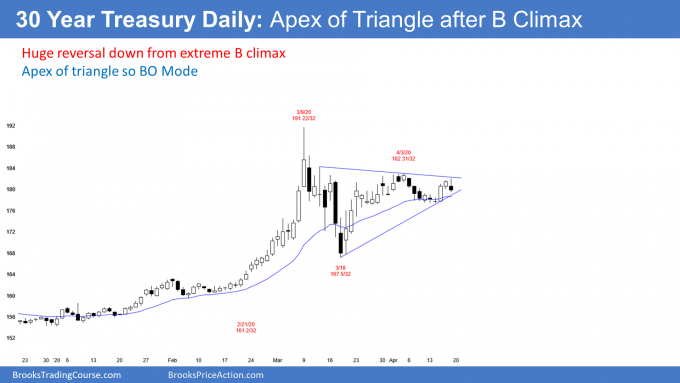
The 30 year Treasury bond futures daily chart has been in a tight range for the past 4 weeks. This follows the most extreme buy climax in history.
When there is an extreme buy climax, the bulls take profits. That does not mean that the bears take control, although there sometimes is an immediate trend reversal down. It is more common for the bull trend to pause. The more extreme the buy climax, the longer the pause. The bulls want to see if the bears are strong enough to reverse the trend. If not, the bulls will buy again.
This buy climax was present on the daily, weekly, and monthly charts. As a guide, traders expect at least 2 legs sideways to down over about 10 bars. Because there is a buy climax on the monthly chart, the sideways to down trading could last about a year.
Daily chart is in a triangle
The daily chart has been forming higher lows and lower highs since the March 9 high. It is therefore in a triangle.
A triangle is a Breakout Mode pattern. When a chart is in Breakout Mode, traders expect an eventual breakout to lead to a trend. But they know that the 1st breakout up or down fails 50% of the time.
It is important to understand that a chart cannot not be in a Breakout Mode pattern unless the probability of a successful bull breakout is the same as for a bear breakout. Think about this. If there was a 60% chance of a bull breakout, traders would not wait for the breakout. Why wait and buy higher when you know that it is going up?
Does a bull breakout above the triangle on the daily chart mean that there will be a rally to a new high? No. There is plenty of room up to the March high for a successful bull breakout to get near the old high without going above it. If it rallies to near the old high, the rally will probably reverse down and then form a bear leg in the developing yearlong trading range.
Monthly chart has a tiny inside doji bar in April after a huge buy climax
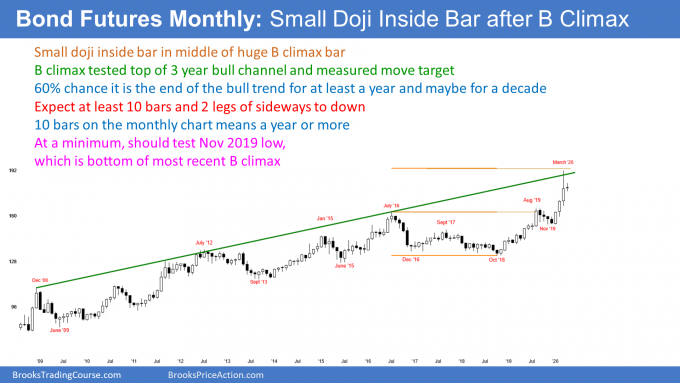
On the monthly chart, this month’s high is far below last month’s high. Also, its low is far above last month’s low. April is an inside bar. Additionally, its range is tiny compared to March’s.
Furthermore, it is currently near the open of the month. That makes it a doji bar at the moment, which is neutral. Finally, it is almost exactly in the middle of March’s range. This month is therefore as neutral as it could be after an extremely strong 3 month rally.
If this month remains an inside bar, it will be a Breakout Mode bar on the monthly chart in addition to the Breakout Mode pattern (a triangle) on the daily chart.
That means April will be both a buy signal bar and a sell signal bar for next month on the monthly chart. The bulls will see March as a High 1 bull flag buy signal bar in a strong bull trend. But the bears will see it as a sell signal bar for a reversal down from an extreme buy climax.
If the month closes near its high, a bull breakout will be more likely in May. The bears want it to close near its low. That would increase the chance of a bear breakout.
If it closes near the open, it will be a lower probability signal bar for both the bulls and bears. That would increase the chance of more buyers below its low and more sellers above its high.
Trading range for the rest of the year
Does it really matter how April looks once it closes in a couple weeks? Not really. The monthly chart is likely to be sideways to down for the next year. If it goes up for a couple months, it will then probably reverse down.
What happens if it begins to trade down? When there is a reversal down from a buy climax, the selling usually continues down to the bottom of the buy climax. That is the January low of around 154. But it could take a year to get there and it might go up a little first.
Also, if it gets there, the bulls will probably start to buy again. That would create at least a bounce for a few months.
EURUSD weekly Forex chart:
Bear channel, but tight trading range so Breakout Mode
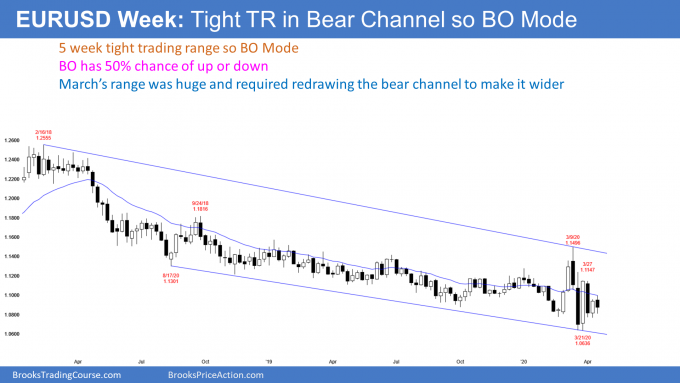
The EURUSD weekly Forex chart has had dramatic reversals up and down over the past 5 weeks. There was an expanding triangle and then a triangle (I did not draw the lines this week). That is a diamond pattern, which, like all trading ranges, is a Breakout Mode pattern.
This week triggered a buy signal by going above last week’s high. Last week was a bull bar closing near its high. It formed a micro double bottom with the bar from 2 weeks earlier. Since this is taking place near the bottom of the 3 month range, the EURUSD is more likely to trade up than down over the next few weeks.
However, this week was a bear bar. Not only is that a bad entry bar for the bulls who bought above last week’s high, this week is a sell signal bar for next week. The bears see this week as forming a Low 2 bear flag with the Low 1 bear flag from 2 weeks ago.
Whenever there is both a credible buy and sell signal, the market is in a trading range and in Breakout Mode. There is a 50% chance of a swing down and a 50% chance of a swing up. Furthermore, there is a 50% chance that the 1st breakout up or down will fail.
ioi Breakout Mode pattern on the monthly chart
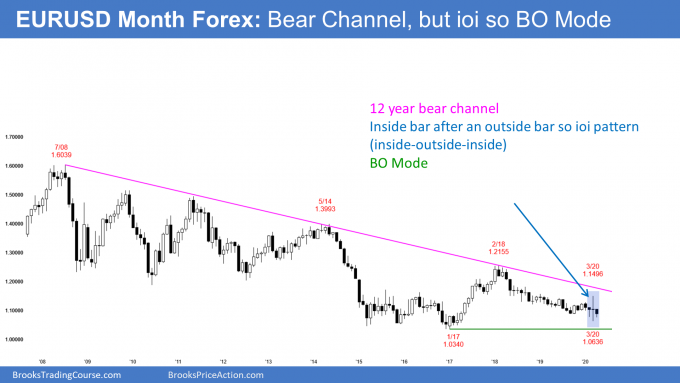
This month’s low is above last month’s low and this month’s high is below last month’s high. April is therefore inside last month’s range. It is an inside bar. That is a breakout Mode bar.
Furthermore, March’s high was above February’s high and March’s low was below. March is therefore outside of February, and February is inside of March’s range.
With April within March’s range, these 3 bars have formed an ioi (inside-outside-inside) pattern. That is a more significant Breakout Mode pattern than simply April being an inside bar. It increases the chance of a trend up or down following the breakout.
The bears see April as a sell signal bar for a Low 2 bear flag. But the bulls see it as a High 2 buy signal bar at the end of a 2 year bear trend. If April ends up as a bear bar closing near its low, the odds of a bear breakout will go up. Conversely, if it is a bull bar closing near its high, the odds of a bull breakout in March go up. A small bull or bear body would increase the chance of another month or two of sideways trading.
Where will a breakout go?
Remember, the 1st breakout of a Breakout Mode pattern fails and reverses 50% of the time. This ioi pattern increases the chance of a breakout of the 7 – 9 month trading range and then a trend lasting for possibly a couple months.
If the bulls get their breakout, the will look for a rally to the September 2018 high. That is the start of the 20 month bear channel. A bear breakout will probably test the January 2017 bottom of the 2017 bull trend. It might continue down to par (1.00).
Impact of the pandemic
When the pandemic struck in February, traders were confident of one thing. They knew it would drastically change the behavior of consumers.
Since consumer spending is responsible for 70% of the GDP, companies would make less money or even lose money. The value of companies is based on earnings. If the total earnings of America’s companies was going to be less, the price of stocks had to fall.
No one knew how bad the unemployment and the reduced spending would be. But everyone knew the economy would be bad. It took a while for America to conclude that life will not get back to normal until there is a vaccine next year. I am a physician with some virology expertise, and I had been saying that from mid-February.
The stock market leads the economy
The stock market is actually a futures market. People buy stock based on what they think the price will be in the future. Therefore, the market typically goes down before there is a recession and up before a recession ends.
The market has rallied strongly over the past 4 weeks. This is because traders concluded that a 34% reduction in the stock market’s price was more than what was needed to account for the damage from the pandemic.
The market is now in search of a price that is appropriate. Traders concluded that the February high is too high and the March low is too low. Somewhere in the middle is just about right.
It will take many months to find the theoretically fair price. As traders become more confident of what the fair price is, the legs up and down will get smaller.
After many months of equilibrium, traders will become confident that there is no more significant risk of a 2nd or 3rd wave of infections and economic damage. Traders will begin to ignore the pandemic and then life will start to get back to normal, or at least a new normal. Once that happens, the bulls would then try to create a rally to a new high.
The vaccine will probably work
Traders want to know that a vaccine will work. Vaccines work for most viruses, but not all. HIV is an obvious example. It took decades to create a reasonably good treatment for people infected with HIV. A satisfactory treatment is one that helps the patient and greatly reduces the chance of spreading the virus to others.
For Covid-19, it would probably also take many years to develop a comparably effective treatment. A treatment without a vaccine would have the world living with the virus indefinitely and possibly forever. That dismal prospect would be a chronic weight on the economy.
Remdesivir might help
There was a report this week from my alma mater, the University of Chicago, concerning Gilead’s Remdesivir. They used it to treat 113 patients with severe disease and most were discharged within a week.
While it is good that the drug appears to reduce the death rate, it is not enough to make American life normal again. Being on one’s death bed and then surviving is better than not surviving. But who ever wants to be so sick that he is on a deathbed? That is not our normal life.
It is important to note that there are politics in everything, including medical research. I was a medical scientist decades ago and saw it for myself at many major medical centers. Also, there are statistical abnormalities that result in what appears to be a good result, but is actually just a coincidence. Doctors know this and therefore want to see similar results from several medical centers before being confident that a drug is truly helpful.
What traders want from a vaccine
Traders want a vaccine will prevent infection in a large percentage of the population. For example, the flu vaccine only works in about 70% of people who get vaccinated. People want a more reliable vaccine than that because Covid-19 is a more serious illness. Traders also want the protection to be permanent or last at least several years.
Viruses mutate. If they mutate enough, the old vaccine is ineffective. I would not be surprised if a coronavirus vaccine gets incorporated into the annual flu shot. That
Finally, traders want to be sure that a vaccine will not have horrible side effects. If it does, many will refuse to get vaccinated. The result will be lots of people choosing to risk getting sick and passing the infection to others. That would prolong the damage to the economy.
These uncertainties will be here for another year. That will probably keep the market sideways into 2021.
But what if the pandemic is not the main problem?
I have mentioned since late 2017 that the Emini was the most overbought in the 100 year history of the stock market. I said that it would probably take a decade for the fundamentals to catch up to the high price.
That is what happened after the buy climaxes in the 1960’s and the 1990’s. Each led to about a decade of sideways trading. There were 50% selloffs and 100% rallies, but the market was in a trading range. The market sometimes made new highs, but they led to a reversal back down instead of a bull trend.
The stock market has been in a trading range for over 2 years. I suspect that it will probably continue in a range between 1800 and 3600 for the rest of the decade. I do think that there will be at least one more new high. It might even come next year. But the market will likely have a difficult time getting far above this year’s high for a long time.
What happens if the market rallies to 4,000 within a few years? That would indicate that the fundamentals had caught up to price. The odds of another bull trend at that point could be better than 50%. But, without that, there is a 60% chance that the 2 year trading range will continue for at least several more years.
Monthly S&P500 Emini futures chart:
Strong reversal up erasing March selloff
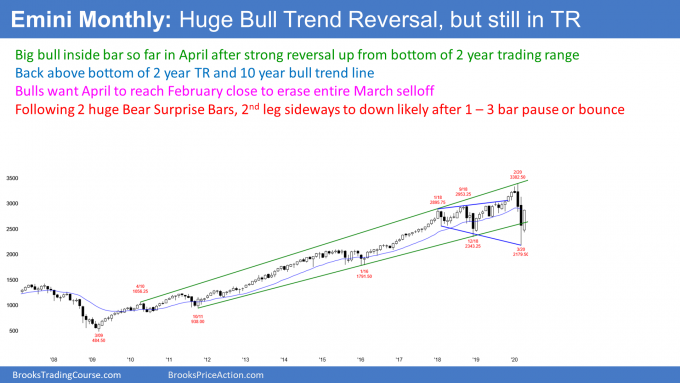
The monthly S&P500 Emini futures chart so far is a big bull bar in April. Its low is above the March low and its high is below the March high. April is therefore an inside bar.
It is important to note that March collapsed below the 10 year bull trend line and the 2 year trading range. It then reversed up dramatically. April is continuing that reversal up.
This is similar to what happened in January 2019. That, too, was a big bull inside bar following a collapse below a 1 year trading range. It was a buy signal bar and the start of a yearlong rally to a new all-time high.
The importance of the February close
The bulls want April to get back above the February close. It will then have erased the March sell climax. Furthermore, it will be a sign of strong bulls. Traders will conclude that the low is in, even if the Emini is sideways for the rest of the year.
We do not know yet if April will close on its high. If it has a prominent tail on top of its candlestick, traders would suspect that the bulls are slightly hesitant. That would reduce the chance of the rally continuing directly up to the old high.
The bulls are hoping that 2020 will be a repeat of 2019. But it will not be. It will probably be more like the rally in early 2018. While it was strong, it ended up as the 1st leg up in a 6 month trading range.
Why is this different from last year?
What are the differences that account for this conclusion? There are several. An obvious one is that the Emini fell 34% in 2 months. This is the most dramatic selloff since the Great Depression. That much selling makes a trading range for the next year more likely than a bull trend.
There are many trapped bulls who bought near the high who are desperate to exit if the rally gets near their entry price. Also, after such a strong selloff, the bears are eager to sell this rally. They know that the odds favor a test down within the next couple months.
In addition, the monthly chart had 2 consecutive big bear bars this time. That is more relentless selling than in late 2018. There was a bull bar in between the 2 big bear bars back then. That hesitation was a sign that the bears were not as determined as they could be. The bulls had less resistance in their reversal up.
History makes a trading range likely
Traders have to pay attention to history. What has the market done when it has sold off 30% in the past?
The low of the March selloff was 34% down from the high. Once a selloff falls 20%, there is a bear market. The final low typically is around 30% down from the high. This selloff has already met that objective. But the final low on average comes a year after the high. Therefore, there is a risk of a new low a year from now.
V bottoms usually do not lead to bull trends
A reversal up form a sell climax is typically very strong. Traders refer to it as a V bottom.
But it is important to understand that a V bottom only has a 20% chance of growing into a bull trend. The 1st leg up is typically minor, even if it is very strong. A minor reversal up in a bear trend is either a bear flag or a bull leg in what will become a trading range.
If there is a reversal back down, traders will then watch for a 2nd reversal up. That would then be a major trend reversal, which means it has a better chance of starting a bull trend. However, a major reversal still has only a 40% chance of growing into a bull trend. More often, it leads to a continuation of the trading range.
Weekly S&P500 Emini futures chart:
Rally getting near the 20 week EMA
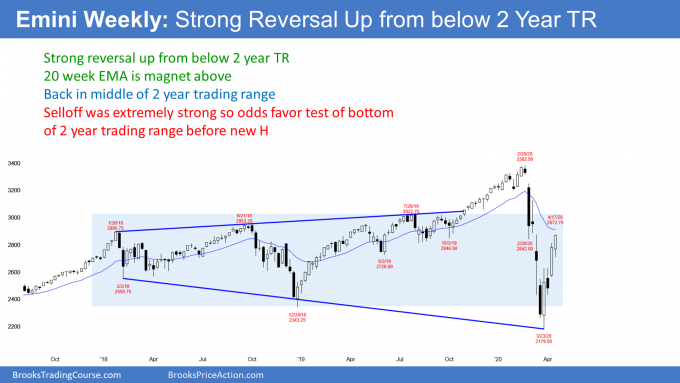
The weekly S&P500 Emini futures chart has rallied 30% over the past 4 weeks. That is incredibly strong. It is now testing the 20 week EMA.
After a 34% selloff, traders expect that this 1st leg up will be minor. In terms of the percentage gained, it has been major. But when traders talk about major and minor trend reversals, this one is likely to be minor. That means another leg in the 2 year trading range is more likely than a resumption of the 11 year bull trend.
A bull leg in a trading range eventually transitions into a bear leg. Traders expect the bear leg to begin within the next few weeks.
Only minor reversal down
The rally erased a lot of the damage from the 2 month crash. But the bulls will probably have a difficult time extending the current leg up much beyond April. This is because the bulls who bought well (near the March low) know the rally will pull back soon. They will want to take profits before there is much of a reversal down.
Then there are the bulls who bought poorly (near the February high). They will begin to sell out of their longs, relieved to have avoided a huge loss.
Some of the rally is caused by bears who sold poorly (near the March low) and are being squeezed out of painful, losing positions. Once the remaining shorts have exited, there will probably not be many traders left to buy at the high. Also, strong bears will begin to scale into shorts now that the rally has reached the 20 week EMA.
The increasing selling by both the bulls and the bears should soon overwhelm the buying by any traders left who are buying up here. The result will be a reversal back down.
After a strong rally like this, the minimum objective is a 2 week pullback. Another is a 50% retracement of the 4 week rally. At that point, traders will watch to see if the selloff is stalling and forming another higher low. If so, they will expect a test of the top of the current rally.
Daily S&P500 Emini futures chart:
V bottom wedge rally testing February close
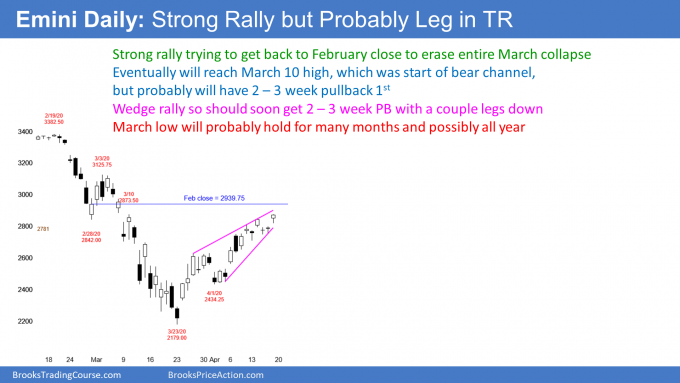
The daily S&P500 Emini futures chart has rallied strongly in a Small Pullback Bull Trend for 4 weeks. It has retraced more than 50% of the 2 month bear trend. That is a common resistance level. It is now testing the 50 day moving average and the 20 week EMA.
Most importantly, the bulls are trying to get back to the February close. If they succeed, they will have completely erased the March collapse.
How much higher before there is a pullback?
The rally has had 3 legs up. It is therefore a wedge. A wedge rally usually begins to attract sellers. The bulls see it as a buy climax and they start to take profits. Also, the bears expect the profit-taking to lead to lower prices. They therefore begin to scale into shorts.
Like most wedges, this one does not have a perfect shape or a strong sell signal bar. Because the bull channel is tight, many bulls see the trend as strong. They therefore are continuing to buy. They are trying to reach the February close before taking profits.
The rally also might reach the March 3 lower high. That was the start of the parabolic wedge bear channel. It is a reliable magnet. The bulls will probably get there at some point in 2020. But it might be too far up to reach before there is a 2 – 3 week pullback.
Because this rally has been extremely strong, the bulls will buy the 1st pullback. That is true even if it falls all of the way to the April low. More likely, it will probably not fall much below a 50% retracement of the rally.
Support and resistance are magnets
There are 3 remaining magnets above. The obvious one is the all-time high. That may be out of reach for 2020.
The nearest one is the February close, which is near the 20 week EMA (on the weekly chart). That Emini should get there, maybe even next week.
Next is the March 3 lower high. That was the start of the parabolic wedge sell climax. The start of a bear channel typically eventually gets tested when a sell climax reverses up. But it might be too far above the bear trend low. There may be one or more 2 – 4 week pullbacks before the Emini can reach it.
The Emini is currently testing the resistance of the 50 day simple moving average and the March 10 lower high. Institutional traders watch 50, 100, 150, and 200 day simple moving averages. These averages therefore are often support or resistance. Traders will watch next week to see if the bears are able to create a reversal down.
What to expect when there is a reversal down
When a wedge rally reverses, it usually does so at resistance. If the Emini does reverse, traders will look for a couple legs down to support over the following 2 – 4 weeks.
One downside target is 2706. That is 20% down from the high. If the Emini falls below that level, it will be back in a bear market.
Below that is the March 31 high. That is the breakout point for the 2nd leg up. That should get tested during the pullback.
Less likely is the April 1 higher low. While the Emini will probably get there this year, it is now so far above that price to make it is unlikely to fall that far within the next couple months.
Traders should expect sideways to up trading for another week or two. Then, the Emini will probably pull back for a few weeks. After this strong of a rally, traders will buy the pullback.
Trading Room
Traders can see the end of the day bar-by-bar price action report by signing up for free at BrooksPriceAction.com. I talk about the detailed Emini price action real-time throughout the day in the BrooksPriceAction.com trading room. We offer a 2 day free trial.
Charts use Pacific Standard Time
When I mention time, it is USA Pacific Standard Time (the Emini day session opens at 6:30 am PST, and closes at 1:15 pm PST). You can read background information on the intraday market reports on the Market Update page.

