Trading Update: Monday August 21, 2023
S&P Emini pre-open market analysis
Emini daily chart
- The Emini sold off testing the 100-day moving average and reversed up. The recent selloff is strong that the first reversal up will likely be minor and lead to a second leg down.
- The bears are still hopeful they will get a measured move down of the wedge bull flag (July 27th, Aug 4th, Aug 11th). The measured move projects down to 4,285, two points below the February 2nd breakout point high.
- Since the daily chart is in a trading range, the odds are that the bears who sold above the February 2nd high will make money. This means that the odds are that the market will fall below the February 2nd high and relieve any trapped bears.
- The bulls are hopeful that the recent selloff down to the August low is a sell vacuum test of support. Next, the bulls want a sharp reversal up, which would trap any of the bears betting on a second leg down of the August selloff.
- More likely, the best the bulls can expect is a trading range and any reversal leading to a minor reversal.
- The bulls need to develop more selling pressure if they are going to get a reversal up. Ideally, the Bulls need at least a micro double bottom. The odds would still favor a minor reversal even if the bulls can form a micro double bottom.
- Overall, the first reversal up will likely be minor and lead to a second leg down.
Emini 5-minute chart and what to expect today
- Emini is up 9 points in the overnight Globex session.
- The overnight Globex market on the 60-minute chart formed a second leg up, following last Friday’s reversal up.
- While the rally is good for the bulls, the overall context increases the odds that any rally will lead to a bear flag or a trading range, not a reversal. This means the odds favor a trading range and not a bull-trend day.
- The bears are hopeful they can form a bear trend day that leads to a test of a new low.
- Traders should expect a trading range open lasting a couple of hours. Most traders should consider not trading the first 6-12 bars. If a trader waits just 6 bars on the open before trading, they will gain more certainty on the day structure in front of them, increasing their odds of catching the high or the low of the day.
- There is at least an 80% chance of a swing trade developing before the end of the second hour. It is common for the swing trade to develop after forming a double top/bottom or a wedge top/bottom.
- Lastly, traders should assume the day will be a trading range until there is a strong breakout with follow-through. If the day is going to become a trend, there will be plenty of time to enter the trend’s direction.
Friday’s Emini setups

Al created the SP500 Emini charts.
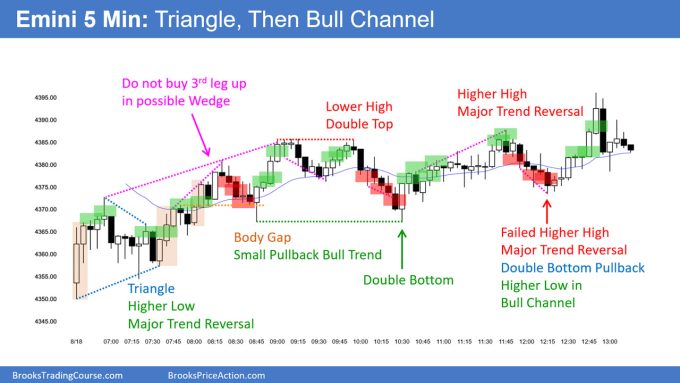
Here are several reasonable stop entry setups from Friday. I show each buy entry with a green rectangle and each sell entry with a red rectangle. Buyers of both the Brooks Trading Course and Encyclopedia of Chart Patterns have access to a near 4-year library of more detailed explanations of swing trade setups (see Online Course/BTC Daily Setups). Encyclopedia members get current daily charts added to Encyclopedia.
My goal with these charts is to present an Always In perspective. If a trader was trying to be Always In or nearly Always In a position all day, and he was not currently in the market, these entries would be logical times for him to enter. These therefore are swing entries.
It is important to understand that most swing setups do not lead to swing trades. As soon as traders are disappointed, many exit. Those who exit prefer to get out with a small profit (scalp), but often have to exit with a small loss.
If the risk is too big for your account, you should wait for trades with less risk or trade an alternative market like the Micro Emini.
EURUSD Forex market trading strategies
EURUSD Forex daily chart

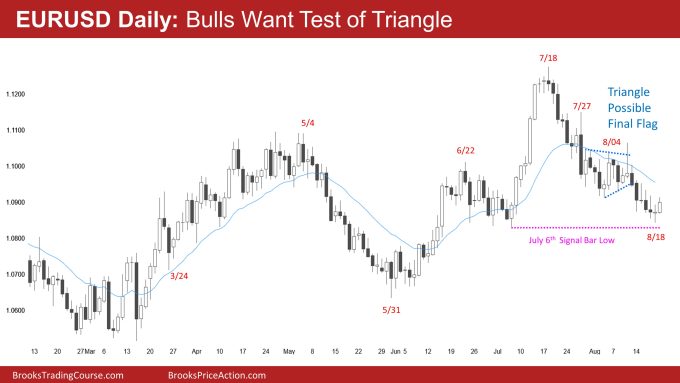
- The EURUSD is forming several overlapping bars following a bear breakout of a triangle (blue dashed lines).
- The triangle will probably act as a final flag, meaning the market will likely test the apex (middle) of the triangle soon.
- The bears have done well over the past few weeks. However, the selloff looks more like a bear leg in what will become a trading range. This means the bulls will probably get a rally lasting a couple of legs soon.
- Overall, traders should expect the bears to become disappointed and for the market to reach the triangle’s apex soon.
Summary of today’s S&P Emini price action

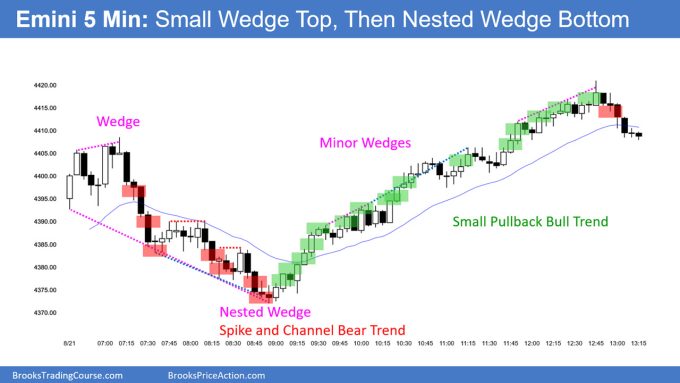
Al created the SP500 Emini charts.
See the weekly update for a discussion of the price action on the weekly chart and for what to expect going into next week.
Trading Room
Al Brooks and other presenters talk about the detailed Emini price action real-time each day in the BrooksPriceAction.com trading room days. We offer a 2 day free trial.
Charts use Pacific Time
When times are mentioned, it is USA Pacific Time. The Emini day session charts begin at 6:30 am PT and end at 1:15 pm PT which is 15 minutes after the NYSE closes. You can read background information on the market reports on the Market Update page.

