- Market Overview: Weekend Market Analysis
- 30-year Treasury Bond futures
- Bond futures weekly chart has an ii at apex of a triangle
- EURUSD Forex market
- EURUSD weekly chart rallying strongly but in a 3rd leg up
- S&P500 Emini futures
- Monthly Emini chart is forming a small bull follow-through bar in December
- Weekly S&P500 Emini futures chart might form a nested wedge top
- Daily S&P500 Emini futures chart has wedge rally in a Small Pullback Bull Trend
- What about Tesla and the S&P500?
Market Overview: Weekend Market Analysis
The SP500 Emini futures market is rallying into the end of the year. But the bars on the daily chart are weak, and there is a nested wedge on the weekly chart. This increases the risk of a pullback to 3,500 starting by early January.
The Bond futures weekly chart has an ii pattern at the apex of a 9-month triangle. Traders should expect a breakout up or down soon.
The EURUSD Forex market is rallying strongly, but there is the potential for a nested wedge top to develop in the next few weeks. There will probably be a pullback lasting at least two to three weeks before the rally reaches the February 2018 high above 1.25.
30-year Treasury Bond futures
Bond futures weekly chart has an ii at apex of a triangle
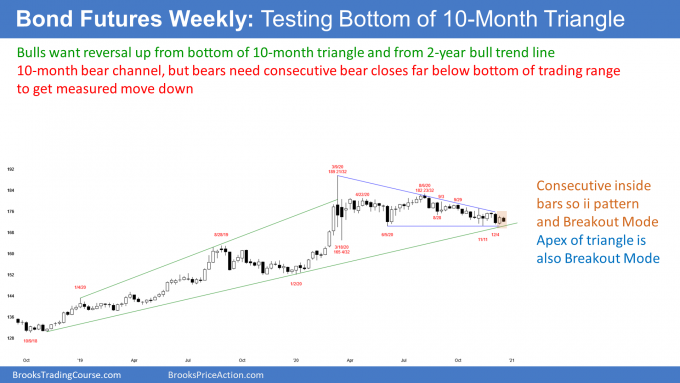
The low on this week’s weekly bond futures chart is above last week’s low. Also, the high is below last week’s high. This week is therefore an inside bar on the weekly chart. Furthermore, it is the 2nd consecutive inside bar. That is an ii (inside-inside) Breakout Mode pattern. It increases the chance of a trend up or down beginning next week.
When a chart is in Breakout Mode, there generally is a 50% chance that the 1st breakout up or down will fail. Also, there is a 50% chance that the eventual successful breakout will be up, and a 50% chance it will be down.
Traders adjust the percentages based on context (the bars to the left). With the bond market trending down in a Small Pullback Bear Trend since August, the probability is slightly greater for the bear breakout. But not much. If it was much greater, the bonds would already be breaking out.
The market can only be sideways if the number of dollars buying equals the number selling. You must assume that the bulls and bears are balanced at the moment, despite the consensus that rate will be higher several years from now.
The market might have to reach the bull trend line before traders decide on the direction of the breakout. It can get there by going sideways for a couple more weeks, or by going a little down.
Apex of 9-month triangle
It is important to note that the weekly bond futures chart is at the bottom of a 9-month triangle. It is also at the apex, which increases the chance of a breakout up or down coming soon.
If everyone knows that interest rates are going up, which means that bonds are going down, why aren’t bonds going down now? Because this is a crowded trade. What that means is that a lot of institutions expecting higher interest rates might have already positioned themselves for this. There might not be enough other institutions willing to sell at this price, and time to drive the bond futures lower.
Possible short-covering rally
Many of those shorts will get nervous if the bear breakout does not come soon. What do nervous bears do? They buy back some or all of their shorts. The result can be a bond rally that could last a month or more, even though everyone knows rates are eventually going up.
Remember, «early» in trading means wrong. Those institutions who loaded up on shorts can get squeezed out. With/if enough panic around the same time, there can be a sharp rally in the bond market, even though the bond market might have begun a bear trend in March.
Bear trends have rallies, and some can be strong and last a long time. I am not predicting a rally to above the March high. There is only a 30% chance of a breakout above the March high at this point. But there could easily be a bounce back to the middle, or even the top of the 9-month range.
Until there is a breakout, there is no breakout. Legs in trading ranges are always more likely to reverse than to lead to a successful breakout. Consequently, it is still more likely that the bond market will go up for at least a week or two, before breaking strongly below the June low.
But I have said many times this year that the bond market will be lower 5 and 10 years from now. That is still true. That does not preclude it from being higher 5 days or even 5 weeks from now. Until there are consecutive closes below the bottom of the trading range, the bond market is still mostly neutral, despite the long-term negative bias.
EURUSD Forex market
EURUSD weekly chart rallying strongly but in a 3rd leg up
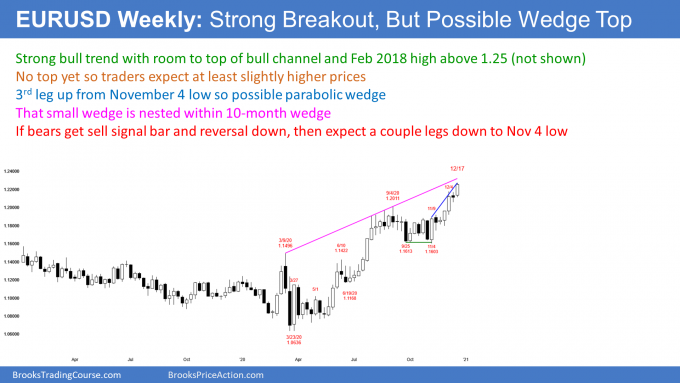
The EURUSD weekly chart formed a big bull bar this week, and it closed near the high of the bar. It is the 3rd push up in the strong rally from the November 4 low.
If there is a reversal after 3 legs up in a tight bull channel, there is a parabolic wedge top. That would make a couple legs down likely. But there is no reversal yet, and there are two important magnets above. Traders expect at least slightly higher prices next week.
The more important of the magnets is the February 2018 lower high. That was the start of a 2-year bear trend. The other magnet is the top of the 10-month bull channel that began in March. The 1st 2 points of the channel are the March 9 and September 1 highs.
What happens if the EURUSD reverses down from around the top of the 10-month bull channel? Traders would see that as a wedge reversal.
But remember that I just said that there is a possible small parabolic wedge that began at the November 4 low. That wedge is the 3rd leg up in the bigger wedge bull channel that began in March. There is therefore a nested wedge pattern. If the bears get a reversal down in the next few weeks, there would be an increased chance of at least a couple legs down on the weekly chart. Also, when there is a wedge reversal, it usually falls to the bottom of the most recent leg up. That is the November low around 1.16.
What is likely at the end of 2020?
The EURUSD has been trending up strongly since March. It will probably be at least a little higher next week. The bulls want the year to close on the high of the year. Traders would then expect higher prices into at least early January.
The EURUSD will eventually reach the February 2018 high above 1.25, but not necessarily in the next couple months. While the February 2018 high is a strong magnet, a magnet in a bull trend is also resistance. Therefore, the EURUSD might reverse down from that high, or even from far below that high.
Also, the EURUSD is near the top of a bull channel. There is usually at least some profit taking when a market gets to the top of a bull channel. Look back at August when the market formed the top of the 2nd leg up in the channel. The EURUSD went sideways for 2 months. There should be at least a pause for a couple weeks around the top of the channel.
If the profit taking is strong, the bears could get a good sell signal bar, or a micro double top. If either were to happen, traders would start to wonder if the nested wedge top was going to lead to a reversal down for several weeks.
S&P500 Emini futures
Monthly Emini chart is forming a small bull follow-through bar in December
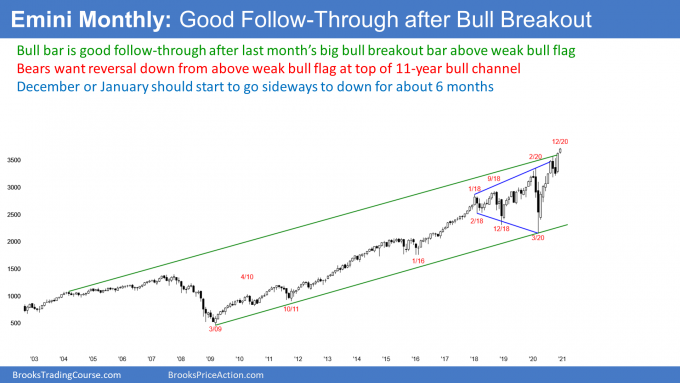
The monthly S&P500 Emini futures chart has a bull bar so far in December. The bulls want this month to close near its high. After a big bull bar in November, that would increase the chance of higher prices in January.
However, right before a bar closes on any timeframe, there is often a sharp move that significantly alters the appearance of the bar. December 31 is the close of a week, a month, a quarter, and a year. Some institutions concentrate on one time frame while others focus on a different time frame. But when many time frames end at the same time, there is an increased chance of lots of institutions acting simultaneously, which could result in a big move in either direction.
This is especially true with the monthly chart being in a buy climax. When a rally is climactic, there is an increased chance of an acceleration up into a blow-off top, and of a reversal down.
Can the bears get an end-of-the-year selloff?
While this month is currently a bull bar closing on its high, if there is a 50-point selloff by the end of the year, December will close near the open of the month. It would then be neutral, which would disappoint the bulls. If enough disappointed bulls exit, January could reverse much of December.
If that were to happen, there would be an increased chance of at least a couple legs sideways to down. This is because the High 1 bull flag in October was a bear bar. September was also a bear bar. When a bull flag has bear bars and it is late in a bull trend, the breakout is typically brief. In addition, the pullback typically has a couple legs sideways to down. Consequently, a reversal in late December, or in January, could lead to a test of the middle or bottom of the trading range that began in September. Therefore, there is an increased chance of about a 10% pullback to below 3,500 beginning within a month.
Will 2021 gap up on the yearly chart?
I will post the yearly chart at the end of the year. If December closes on its high, the year will close on its high. If the Emini were to gap up on January 4, when 2021 begins trading, there would then also be a gap up on the weekly, monthly, and yearly charts.
I do not know if the stock market has ever gapped up on the yearly chart. But if it does, the gap would be small on that chart. Small gaps typically close before the bar closes. A bar on the yearly chart takes a year to close. Therefore, if there is a gap up, it could stay open for many months.
That is unlikely. The gap would also be small on the monthly chart. Traders would expect it to close before the end of January. If it is small on the weekly chart as well, they will expect it to close in the 1st week of 2021.
Weekly S&P500 Emini futures chart might form a nested wedge top
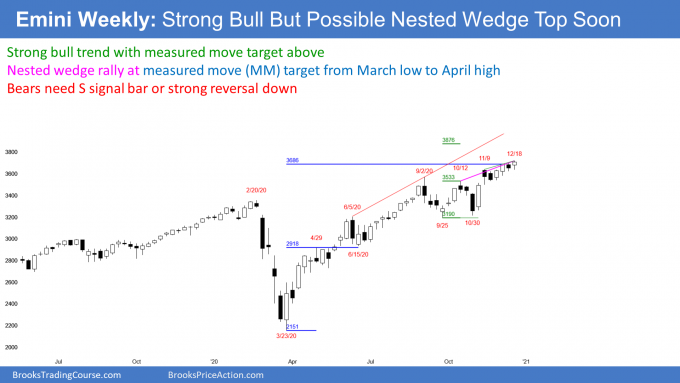
The weekly S&P500 Emini futures chart formed a bull bar this week, and it closed near its high. Because it is coming in a strong, 10-month bull trend, traders continue to expect at least slightly higher prices.
However, this week is the 3rd push up in the past 6 weeks. If there is a reversal down next week, the rally would be a micro wedge top. A micro wedge on the weekly chart is a traditional wedge on the daily chart.
The rally up from the March low has been extremely strong. There was only one 3-week pullback. All of the other pullbacks ended after just a week or two.
But if there is a reversal down from a micro wedge, it should have at least a couple small legs sideways to down. That would take at least 3 or 4 weeks. Consequently, if a pullback begins in the next few weeks, it will probably last longer than any other pullback since the pandemic low. At a minimum, traders would expect it to test the start of the micro wedge. That is the November 10 low, which is also around the 3,500 Big Round Number.
First reversal down in strong bull trend is usually minor
Can a reversal down be the start of a bear trend? Probably not. The rally from the March low has been in a tight bull channel. A reversal down in a Small Pullback Bull Trend is typically minor. That means it becomes a bull flag, or it is a bear leg in what will become a trading range. If it is the start of a trading range, traders would expect a bull leg and a test of the high before there is a bear trend.
But if the Emini enters a trading range and then has a reversal, the reversal will come from a double top. If there was a good sell signal bar in addition to the double top, there would be a 40% chance of a bear trend.
Possible nested wedge top
In addition to the micro wedge over the past 6 weeks, the rally from the September 24 low has had 3 legs up. The 1st top was the October 12 high and the 2nd was the November 9 high. Therefore, the micro wedge is nested within a bigger wedge. Nested patterns have a higher probability of leading to at least a couple legs down.
Wedges often do not have a wedge shape. For example, this bigger wedge does not look very much like a wedge. This will result in fewer institutions expecting it to lead to a significant reversal down.
There is another bigger wedge as well. The entire rally from the March low has had 3 legs up. The 1st ended with the June 5 high, and the 2nd ended on September 2. The two other wedges are nested within it.
But since none of the wedges look like a conventional wedge, traders will be less inclined to expect them to behave like traditional wedges. That reduces the chance of a big reversal down. However, the climactic rally from the March low and the micro wedge, are enough to expect a pullback to begin by early January, and for it to have at least a couple small legs down.
Daily S&P500 Emini futures chart has wedge rally in a Small Pullback Bull Trend
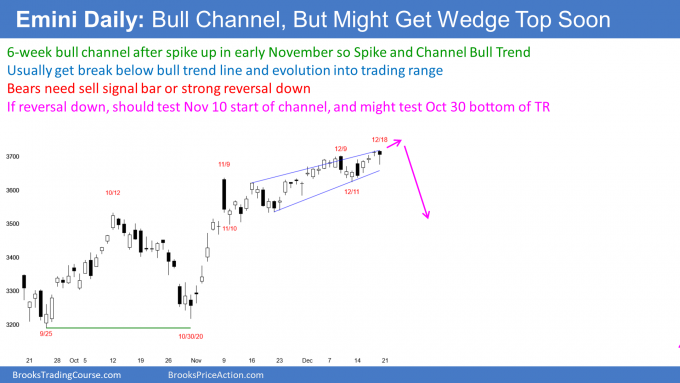
The daily S&P500 Emini futures chart has rallied strongly to a new high from the November 10 low. The rally has been a Small Pullback Bull Trend, which is a very strong type of bull trend. A strong version of it has at least a couple breakouts, with consecutive big bull bars closing near their highs. When that happens, the rally will often last far more than 50 bars
But the current rally has lacked that aggressive buying. That makes it more likely to be a bull leg in a trading range. A trading range has bull and bear legs. Therefore, when there is a strong bull leg, traders begin to expect a bear leg to begin soon. That is the case here.
There is another problem with the rally. About 75% of the bars since late October closed near the open or middle of the bar. Wednesday, Thursday, and Friday were examples. Those bars are neutral instead of bullish. A bull trend that continues for a long time typically has far more bull bars closing near their highs. This lack of strong bull bars further increases the chance of a two to three week pullback beginning by early January.
Possible Black Swan event in January
Then, there is Washington, D.C. The politicians are going to behave well through the January 5 Georgia senate elections. However, the following two weeks will be the end of Trump’s presidency, which has been very emotional. There is an increased chance of significant and bad decisions from both sides, and from other countries, during those two weeks. I suspect there is a 30% chance of a Black Swan event appearing during that window. So what could it be? If I knew, it would not be a Black Swan!
As for the current rally, there is no top yet. Traders continue to expect at least slightly higher prices. But the lack of strong thrusts up make it likely that the rally will not last much longer.
What about Tesla and the S&P500?
Tesla is getting added to the S&P500 index before the open on Monday. The S&P500 index has never added a $600 billion company before, and it will be interesting to see what happens on Monday. There are huge funds that track the S&P, and they bought Tesla in the final seconds on Friday.
Those funds have one goal and it is to mirror the S&P. It is not to beat it. They therefore had to buy Tesla into the close on Friday. There are also lots of funds that unofficially or loosely track the S&P, and they bought as well. That is why Tesla on Friday had such huge volume at the end of the day. Those funds that mirror the S&P could not buy Tesla sooner, and they can not wait a couple weeks to buy it a pullback.
Everyone knows that, and lots of other firms have been buying it in advance, knowing that there was going to be forced buying on Friday’s close. If you ran a hedge fund that bought ahead of Friday because you knew Friday would have lots of Tesla buyers on Friday’s close, and there clearly will be no one to buy Tesla after Monday, what will you do on Monday or Tuesday? SELL!!
When something obviously will happen, it usually does not happen
It is so obvious that Tesla would rally at the end of the day on Friday, and sell off on Monday or Tuesday that everyone knows it. Whenever something is obvious, it is a crowded trade, and it typically will not do what it obviously should do.
For example, many funds that wanted to buy ahead of time might have decided that it was already too expensive. They then might wait to buy later next week after a pullback. If there are lots of funds thinking this way, Tesla may go up this week instead of down.
What if there is severe selling on Monday, or next week, that it scares institutions who are not in Tesla? They might wonder if the collapse in Tesla (if it collapses, which is unlikely) might be a sign that there will be lots of tax selling of all stocks into the end of 2020, just in case Biden wins the senate on January 5 and raises taxes for 2021.
The point is that there is the potential for surprises in Tesla next week, which can cause a big move up, down, or in both directions. If there is also a big move in the market, will it be caused by Tesla? Not necessarily, but there will be a consensus that Tesla was the trigger. Tesla therefore will probably be a bellwether for the overall market.
Incidentally, there is research that shows that when a big market cap company gets added to the S&P, the stock is down as much as 7% a year later. With Tesla being extremely overbought, it could fall much more. Over the next month, it might put in its high for many years. If it were to reverse down, the 3-month triangle at 400 would be an obvious target.
Also, a stock that gets kicked out is up an average of 20% a year later. Tesla is replacing AIV. If you look at its chart, you will see that it fell 87% earlier this week. Don’t blame Tesla. AIV spun off part of its business into a 2nd publicly traded company, and that is the cause of the huge gap down.
Trading Room
Traders can see the end of the day bar-by-bar price action report by signing up for free at BrooksPriceAction.com. I talk about the detailed Emini price action real-time throughout the day in the BrooksPriceAction.com trading room. We offer a 2 day free trial.
Charts use Pacific Standard Time
When I mention time, it is USA Pacific Standard Time (the Emini day session opens at 6:30 am PST, and closes at 1:15 pm PST). You can read background information on the intraday market reports on the Market Update page.

