Trading Update: Monday December 4, 2023
S&P Emini pre-open market analysis
Emini daily chart
- The Emini rallied last Friday, breaking above the prior day’s High 1 buy signal bar. The market will probably pull back today and test the recent High 1.
- While the channel up is tight, the odds favor a test of the moving average soon. The market can reach the moving average by going sideways or selling off to the moving average.
- Because the channel up is tight, the odds favor sideways at the moving average, not a s strong breakout below it.
- It is possible that last Friday was a buy vacuum test above the September 1st high. The market had a perfect double top with the September 1st high last week, and the odds favored the double top failing to have an equal high.
- Overall, the market will probably go sideways soon and test the moving average.
Emini 5-minute chart and what to expect today
- The Overnight Globex market recently formed a strong downside breakout after failing to break out above the November 28th high, which was the equal high (double top) with the September 1st high.
- The recent selloff on the 60-minute chart is strong enough for the market to get a second leg down.
- The bears want the market to gap down and form a strong bear trend day.
- More likely, the gap down will lead to sideways trading on the open, which will drag the moving average higher.
- Most traders should be patient on the open and consider waiting for 6 – 12 bars unless they are comfortable making quick decisions. This is because most breakouts lead to sideways trading on the open.
- Traders should try and catch the opening swing that often begins before the second hour after the formation of a double top/bottom or a wedge top/bottom.
Friday’s Emini setups

Al created the SP500 Emini charts.
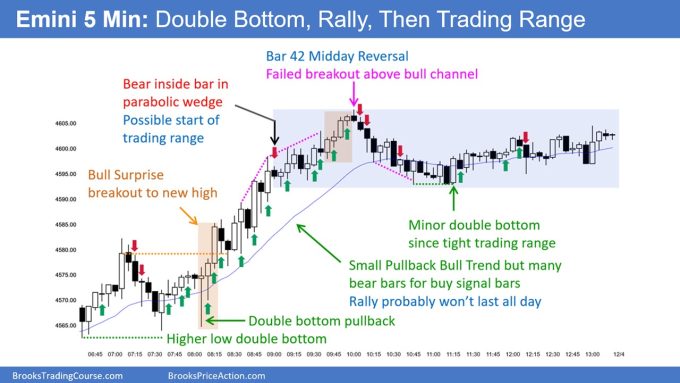
Here are reasonable stop entry setups from Friday. I show each buy entry bar with a green arrow and each sell entry bar with a red arrow. Buyers of both the Brooks Trading Course and Encyclopedia of Chart Patterns have access to a near 4-year library of more detailed explanations of swing trade setups (see Online Course/BTC Daily Setups). Encyclopedia members get current daily charts added to Encyclopedia.
My goal with these charts is to present an Always In perspective. If a trader was trying to be Always In or nearly Always In a position all day, and he was not currently in the market, these entries would be logical times for him to enter. These therefore are swing entries.
It is important to understand that most swing setups do not lead to swing trades. As soon as traders are disappointed, many exit. Those who exit prefer to get out with a small profit (scalp), but often have to exit with a small loss.
If the risk is too big for your account, you should wait for trades with less risk or trade an alternative market like the Micro Emini.
EURUSD Forex market trading strategies
EURUSD Forex daily chart
- The EURUSD is trying to get a close below the moving average for the first time in several days.
- The selloff last week is strong enough to convert the rally up to the November high into a trading range.
- The bears next want to test the November 6th breakout point high and close the gap. The Bulls will try to keep it open.
- Traders will pay close attention to see how today will close. The bulls want the day to close above its midpoint, and the bears want the opposite. The bears are hopeful that they will be able to get a close below Friday’s low.
Summary of today’s S&P Emini price action

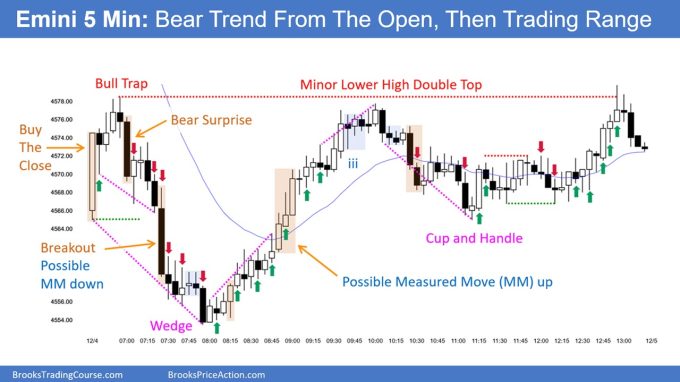
Al created the SP500 Emini charts.
End of day video review
See the weekly update for a discussion of the price action on the weekly chart and for what to expect going into next week.
Trading Room
Al Brooks and other presenters talk about the detailed Emini price action real-time each day in the BrooksPriceAction.com trading room days. We offer a 2 day free trial.
Charts use Pacific Time
When times are mentioned, it is USA Pacific Time. The Emini day session charts begin at 6:30 am PT and end at 1:15 pm PT which is 15 minutes after the NYSE closes. You can read background information on the market reports on the Market Update page.

