Market Overview: Weekend Market Analysis
The SP500 Emini futures traded below January low, triggering the sell signal from the second OO pattern on the monthly chart. However, there was no follow-through selling and the Emini reversed back above the middle of the bar. Monday is the final day of the month. The bulls want a close far above the middle of the bar (4345). The bears on the other hand want a close below the middle of the bar.
The EURUSD Forex tested the trading range low in a sell vacuum but there was no follow-through selling. The EURUSD is in the middle of the 4-month trading range and lack of clarity is the hallmark of a trading range. The bulls want a breakout above the top of the trading range followed by a 400-pip measured move. The bears on the other hand want a breakout below the trading range followed by a 400-pip measured move. Until there is a breakout with strong follow-through, the odds favor that breakout attempts up and down will fail and the 4-month trading range will continue.
S&P500 Emini futures
The Monthly Emini chart
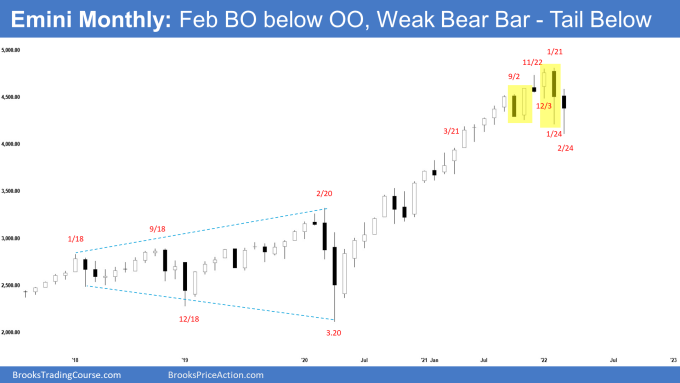
- The February monthly Emini candlestick currently is a bear bar with a long tail below. It broke below the second OO (outside-outside) pattern this week by trading below January low but reversed back higher.
- Al has said that due to the back-to-back OO, traders should expect a break below the January low before a break above the January high. A 2nd attempt has a higher probability of success. That would trigger the OO sell signal on the monthly chart and the selloff would probably last 2 to 3 months. The Emini triggered the sell signal this week and February is the second month of the sell-off.
- We have been saying that while January closed slightly below the middle of the bar, it has a long tail below. That is not a strong sell signal bar. Selling below a moderate sell signal bar at the bottom of a 7-month trading range may be risky if more traders think the trading range is more important and would, therefore, BLSH (Buy Low Sell High). This remains true.
- We have said that this rally is overextended and there is a likely micro wedge top forming which makes it less likely that it will continue up throughout 2022 without a pullback. January & February was the pullback.
- Monday is the last trading day for February and will determine how the monthly bar closes. The Emini is currently trading slightly above the middle of the bar. Bears want February to close below the middle of the bar (around 4345) while the bulls want a close above it. The middle of the bar may be a magnet on Monday.
- The bears want February to close as another bear follow-through bar below January’s low to convince traders that a deeper correction is underway. However, the low of January may be too far to get to on Monday, especially as it followed 2 strong bull bars.
- The best the bears can get is a larger bear body and a close below the middle of the bar.
- The bulls see the January – February selloff as a long-overdue pullback. They want a reversal higher from a micro wedge bull flag (December 3, January 24, February 24) or a double bottom bull flag with the May 2021 or June 2021 low and a retest of the trend extreme followed by a subsequent breakout to a new high.
- Al said that there is a 50% chance that the February 24 low will be the low of the year. March and April form the pair of consecutive months that is the most bullish of the year, and therefore the Emini is entering a timeframe that has an upward bias.
- Al has also said that the bull trend on the monthly chart has been very strong. Even if it sells off for a 10 to 20% correction, that would still only be a pullback on the monthly chart (even though it could be a bear trend on the daily chart) and not continue straight down into a bear trend.
- The best the bears will probably get on the monthly chart is a trading range for many months to around a 20% correction down to the gap on the monthly chart below April 2021 low and around the 4,000 Big Round Number
- Most pullbacks since the pandemic crash only lasted 1 month (Jan 2021, Sept 2021, Nov 2021) except for Sept-Oct 2020 which lasted 2 months. (On a side note, there was a lot of uncertainty during Sept-Oct 2020 period leading into the election between Trump vs Biden.)
- February will likely have a bear body. While it is a consecutive bear bar, if it closes around the middle of the bar or higher, it will have a long tail below therefore a weak sell signal bar.
- Selling below a weak sell signal bar at the bottom of a developing 7-month trading range is not an ideal setup. Odds are there will be buyers below.
- Al has been saying that the bull trend from the pandemic crash has been in a very tight bull channel. The first reversal down will probably be minor even if it lasts a few months.
- The gap up in April 2021 could lead to a measured move up to 5,801 before the bull trend finally ends.
The Weekly S&P500 Emini chart
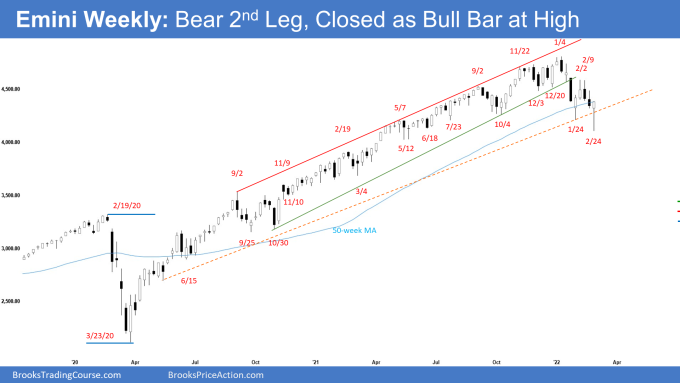
- This week’s Emini weekly candlestick was a bull bar closing at the high with a long tail below, closing above last week’s low and close. It was the second leg down from the pullback which started in January.
- We have said that the selloff in January was strong enough for traders to expect a second leg sideways to down after a pullback (bounce). This week likely has ended the second leg sideways to down.
- The Emini traded below January low but reversed up sharply closing just 1 tick below the high (almost shaved top bar). This is strong buying pressure from the bulls as they bought into the close on Friday.
- This week’s bull bar closing at the high is a strong buy signal bar for next week. Odds are next week should trade at least slightly higher. It may gap up on Monday, however, small gaps usually close early. If next week trades above this week’s high, it will trigger the high 2 buy signal.
- The bulls see the selloff in January – February as a long-overdue pullback. The bulls need to create consecutive bull bars closing near their highs and far above February 2 high in the next few weeks to convince traders that a re-test of the high is underway.
- The bears want a reversal lower from a head & shoulders (H&S) top where the lower high (February 2) is the right shoulder, but an H&S top is often a minor reversal pattern. The 3rd push down from the right shoulder often is the 3rd leg in what will become a wedge bull flag (October 4, January 24 and February 24).
- Can the bears get another leg lower after a brief bounce? Yes. If the bulls fail to get strong follow-through in the next 1-3 weeks, odds are the Emini will form a lower high or a double top bear flag with February 2 followed by a third leg sideways to down.
- If that were to happen, the bears would then want a strong breakout below February 24 low and a measured move down to 3600 based on the height of the 7-month trading range. The bulls on the other hand would want the 3rd push down to be a wedge bull flag where January 24 and February 24 were the 1st 2 legs down.
- Al said that there is a 50% chance that the February 24 low will be the low of the year. March and April form the pair of consecutive months that is the most bullish of the year, and therefore the Emini is entering a timeframe that has an upward bias. If there is a break below that low, the Emini might dip below 4,000, but traders will buy it.
- For now, odds are next week should trade at least slightly higher. Traders will be monitoring whether the bulls can get follow-through buying or the Emini stalls around the February 2 high.
The Daily S&P500 Emini chart
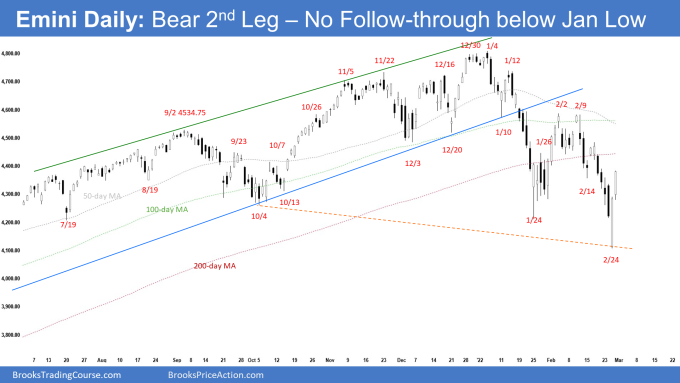
- This week gapped down on Tuesday and had follow-through selling on Wednesday testing the January low. Thursday gapped down far below January low but reversed up sharply into Friday’s close.
- We have been saying odds favor a second leg lower after a pullback from the January sell-off. This week likely has ended the second leg sideways to down.
- The bulls want this to be the start of the reversal up to re-test the trend extreme high from a lower low major trend reversal and a wedge bull flag (December 3, January 24 and February 24).
- Friday closed 1 tick below the high. It is a strong bull signal bar for Monday, increasing the odds of a gap up. Small gaps usually close early.
- The bulls need to create consecutive bull bars trading far above the February 2 high to convince traders that a re-test of the trend extreme is underway.
- Bears want the pullback (bounce) to reverse lower from a lower high or from a double top bear flag with February 2 high. If the bears get that, they then want a measured move down to around 3600 based on the height of the 7-month trading range.
- However, if there is a 3rd pushdown, and especially if it is weak, it will form a wedge bull flag with January 24 and February 24 low.
- Al said that if there is a break below the February 24 low, the Emini might dip below 4,000, but traders will buy it. There is a 50% chance that the February 24 low will be the low of the year. March and April form the pair of consecutive months that is the most bullish of the year, and therefore the Emini is entering a timeframe that has an upward bias.
- We have said that the 50-day, 100-day and 200-day moving averages are resistances above. This remains true.
- Monday is the last trading day of the month, and how the day closes will influence the look of the monthly candlestick. The middle of February’s range around 4345 may be an important magnet on Monday.
- For now, odds slightly favor sideways to up for next week. Traders will be monitoring if the bulls can create strong follow-through buying or if the Emini stalls at some resistances above such around the February 2 high or the 50-day, 100-day or 200-day moving averages area.
EURUSD Forex market
The EURUSD weekly chart
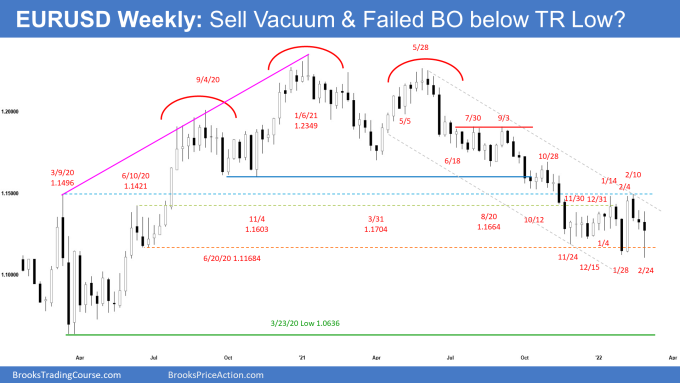
- This week’s candlestick on the weekly EURUSD Forex chart was a bear bar with a small bear body, a long tail below and a prominent tail above.
- The EURUSD re-tested the January low but reversed up to close above the middle of the bar. The sell-off was likely a sell vacuum test of the 4-month trading range low.
- The bears want next week to be the 4th consecutive bear bar followed by a breakout and a 400-pip measured move down based on the height of the 4-month trading range.
- However, this week has a small bear body and a long tail below. It is a weak sell signal bar. Selling below a weak sell signal bar at the bottom of a 4-month trading range is not a high probability bet. Odds are there will be buyers below as traders BLSH (Buy Low, Sell High) in a trading range.
- The bulls want a re-test of the February 10 high followed by a 400-pip measured move higher. However, they will need consecutive bull bars closing above the February 10 high to convince traders that the bull breakout will succeed.
- We have said that the EURUSD is in a tight trading range and odds of reversal are more likely than breakouts. This remains true. Until there is a breakout with strong follow-through, the odds favor that breakout attempts up and down will fail and the 4-month trading range will continue.
- Al said that the EURUSD has been sideways for 7 years. Since trading ranges resist breaking out, it is still more likely that the whole selloff last year will reverse up for many months before breaking below the 7-year range.
- If there is a bear breakout, the bulls will make another attempt at a bottom around the March 2020 low. That would be a higher low double bottom in the 7-year range, and the current 4-month tight trading range would then be a likely Final Bear Flag.
- Currently, the EURUSD is trading around the middle of the tight trading range. Lack of clarity is the hallmark of a trading range.
The EURUSD daily chart
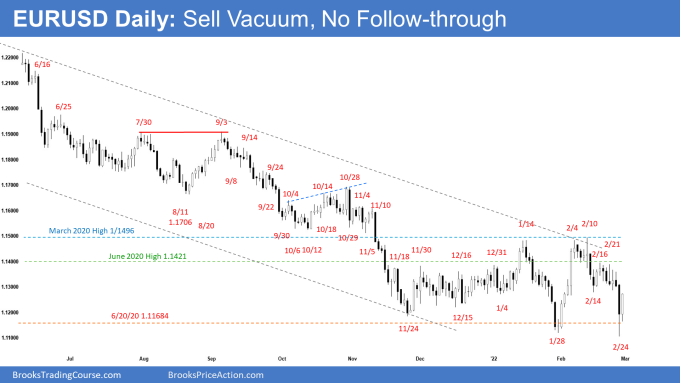
- The EURUSD reversed lower from a micro double top bear flag (February 16 and February 21) and broke below January 28 low.
- Thursday was a sell vacuum test of the trading range low but there was no follow-through on Friday.
- Friday was a bull inside bar closing near the high. It is a good buy signal bar for Monday.
- The bulls hope that it can lead to a re-test of the February 10 high, followed by a strong breakout and a 400-pip measured move up.
- The bears want the pullback (bounce) to reverse lower from a lower high or a double top bear flag with February 16 high. If there is another leg lower, it would be the 3rd leg down since February 4. The first legs down are February 14 and February 24.
- The bears would then want a breakout below the 4-month trading range followed by a 400-pip measured move.
- Which is more likely? We have said that the EURUSD has been in a tight trading range for 4 months. Traders should expect reversals are more likely than breakouts.
- Until there is a breakout with strong follow-through, the odds favor that breakout attempts up and down will fail and the 4-month trading range will continue.
- Al said that because the EURUSD has been in a trading range for 7 years and the current leg down has lasted an unusually long time, traders should expect a rally lasting at least a couple of months before the EURUSD trades much lower.
- If there is a bear breakout, the bulls will likely attempt to reverse higher again around March 2020 low. That would be a higher low double bottom in the 7-year range, and the current tight trading range would then be a likely Final Bear Flag.
Trading Room
Traders can see the end of the day bar-by-bar price action report by signing up for free at BrooksPriceAction.com. I talk about the detailed Emini price action real-time throughout the day in the BrooksPriceAction.com trading room. We offer a 2 day free trial.
Weekly Reports Archive
You can access all weekly reports on the Market Analysis page.

