- Market Overview: Weekend Market Analysis
- 30 year Treasury Bond futures
- The Bond futures weekly chart formed an outside up bar at the bottom of an 8-month trading range
- EURUSD Forex market
- The EURUSD monthly chart has an outside bar after an ioi pattern
- The EURUSD weekly chart is reversing up from a double bottom, but still in a 4-month trading range
- S&P500 Emini futures
- The Monthly Emini chart has an ioi Breakout Mode pattern, and November is trying to get a bull breakout
- The Weekly S&P500 Emini futures chart is reversing up from a double bottom bull flag
- The Daily S&P500 Emini futures chart has a climactic rally to top of the 4-month trading range
Market Overview: Weekend Market Analysis
The SP500 Emini futures contract has rallied strongly to near the top of a 4-month trading range. Friday is a High 1 bull flag buy signal bar on the daily chart. There should be at least a small 2nd leg up, but there might be some profit-taking next week after such an extreme rally. A break to a new high is more likely than a reversal down from a triangle top.
Bond futures this week reversed up strongly from a wedge selloff to the bottom of an 8-month trading range. Bonds should work higher for at least a few weeks, even if there is a pullback next week.
The EURUSD Forex formed an outside bar after an ioi Breakout Mode pattern on the monthly chart. It therefore triggered both the monthly sell and buy signals. Since the rally on the daily chart has been strong this week, traders will buy the 1st 1 – 3-day pullback.
30 year Treasury Bond futures
The Bond futures weekly chart formed an outside up bar at the bottom of an 8-month trading range
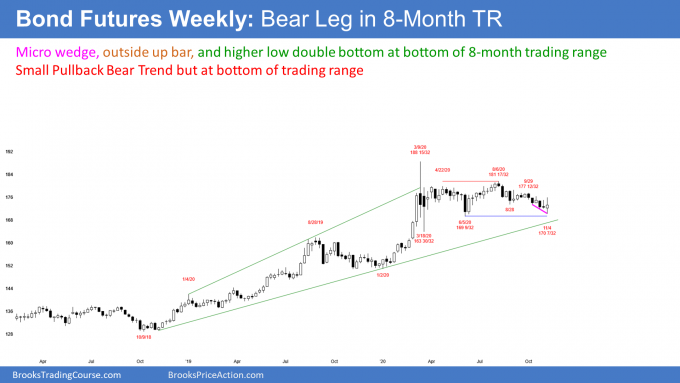
The weekly bond futures formed an outside up candlestick this week by going below last week’s low and reversing up to above its high. While bullish, the week did not close on its high and therefore was not as bullish as it might have been.
That is not a surprise since the bond futures market has been in a trading range for 8 months. Nothing is as bullish or bearish as in trends. Disappointing follow-through and reversals are more common than a leg leading to a successful breakout into a trend.
Bonds should be sideways to up for a few weeks
The bond market has been trending down from a lower high for 4 months. However, this week reversed up strongly from just above the June 5 low, which is the bottom of the range. Because this week was a big reversal week, there will probably be some follow-through buying for at least a few weeks.
This is especially true since the 4-month selloff had several legs down in a channel. The selloff was therefore a type of wedge. A wedge is a sell climax. A reversal up from a sell climax typically has at least a couple legs sideways to up.
Bonds might pullback next week before going higher
While this week was an outside up week, it might have gone too far, too fast. Many bulls might take some profits next week. This reduces the chance that next week will form a 2nd consecutive bull trend bar on the weekly chart. In fact, if there is sustained profit-taking, next week might even be a bear bar. But at the moment, unless it is a big bear bar, most traders would see it as a pullback from this week’s rally.
If next week is an inside bar (high below this week’s high, low above this week’s low), there would then be an ioi (inside-outside-inside) Breakout Mode pattern. It would then be both a buy and sell signal bar for the following week. But since the bonds are at the bottom of a trading range and this week was a big bull bar, a reversal up from an ioi would be more likely than a continuation down.
EURUSD Forex market
The EURUSD monthly chart has an outside bar after an ioi pattern
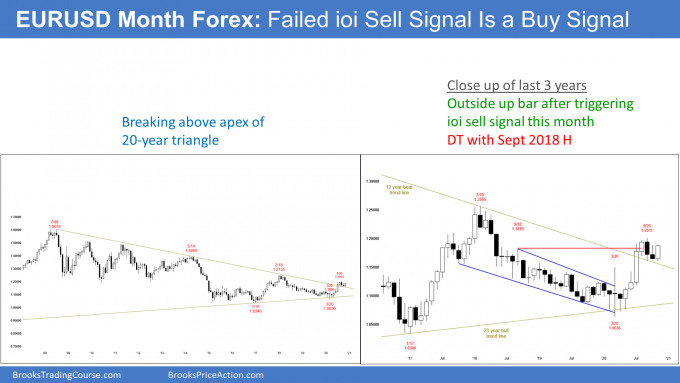
Last month was a bear inside bar after an outside bar. That is an ioi (inside-outside-inside) Breakout Mode pattern. This month traded below last month’s low, which triggered the monthly sell signal.
But, instead of selling off, the EURUSD reversed up. It then broke above last month’s high. It therefore also triggered the ioi buy signal. November is now an outside up bar.
But unless the rally continues to above the high of the ioi, which is the September high, many of the bears who sold below the October low will hold short.
Therefore, there is currently both a credible reason to be short or long on the monthly chart. The chart is back in Breakout Mode.
The bulls want the month to close above last month’s high. They would especially like November to break above the September high because then the ioi bears would give up. That would increase the chance that the summer rally is resuming.
If the bulls can get 2 closes above the September high, the rally will probably continue up to the next target. That is the February 2018 lower high of 1.2555.
The EURUSD weekly chart is reversing up from a double bottom, but still in a 4-month trading range
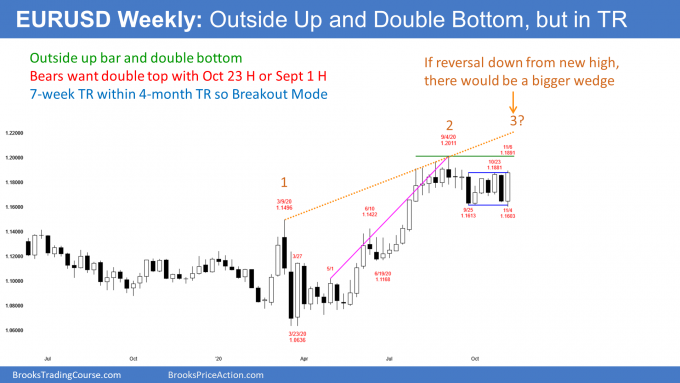
The EURUSD weekly chart has been reversing sharply every week or two for 2 months. After last week’s big bear trend bar, this week formed a big bull trend bar. For the bulls, there is a double bottom bull flag. The bears see the past 6 weeks as a pause after the 1st leg down from a wedge top.
Which is it, a bull flag or a bear flag? It’s both! Every trading range always has both a credible buy and sell signal. Trading ranges are neutral. The chart is in Breakout Mode. There is about a 50% chance that the eventual successful breakout will be up and a 50% chance it will be down.
The probabilities go up and down, depending on what the chart is currently doing. Since this week reversed up strongly from a double bottom, the odds are slightly higher for a bull breakout.
But not much. Until there is a breakout, there is no breakout. Traders will continue to bet on reversals, no matter how strong the legs up and down are. They need to see consecutive closes above or below the 4-month range before concluding that a successful breakout is underway. We don’t have that yet.
EURUSD might evolve into bigger wedge top
Even if the bulls get their new high, if the EURUSD then reverses down, there would be a bigger wedge. The EURUSD has been sideways for 4 months. Traders see the current price as fair. If there is a bull breakout that reverses, the 4-month trading range would be a magnet. It would become the final bull flag. The reversal down would probably have at least 2 legs and last about 10 bars. That would be 2 – 3 months on the weekly chart.
Strong week up, but still in 4-month trading range
So what about next week? After a strong reversal up from a double bottom, traders expect some follow-through buying within a couple weeks. But since this week was big and the EURUSD is now at the top of a 7-week tight trading range, next week might pull back before there is follow-through buying.
And even if the bulls break above the 7-week tight trading range, the EURUSD would still be in its 4-month trading range. That means that traders will expect a reversal down from near the top of the range.
S&P500 Emini futures
The Monthly Emini chart has an ioi Breakout Mode pattern, and November is trying to get a bull breakout
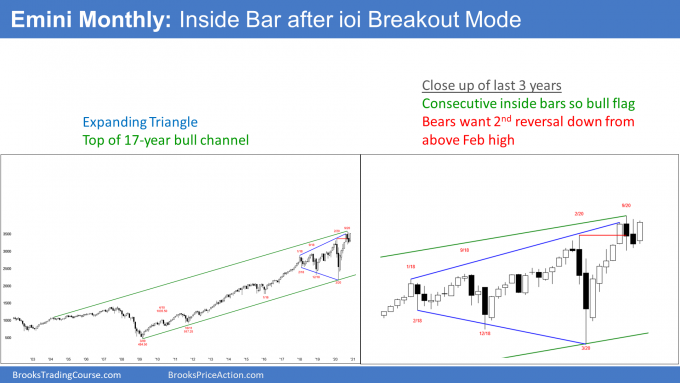
The monthly S&P500 Emini futures chart has been sideways for 4 months. The past 2 months had big bear bodies.
Last month was an inside bar. That means its high was below the September high and its low was above the September low. That is a sign of neutrality. There is now an ioi (inside-outside-inside) Breakout Mode pattern. A Breakout Mode pattern is just about neutral. The inside bar is both a buy and sell signal bar for the next month.
If November goes below the October low, it will trigger a sell signal. The bears see the 5-month rally as a buy climax and a test of the top of the 3-year trading range. November would then be the 2nd reversal attempt in 3 months. Second signals are higher probability bets. Traders would look for a one- or two-month pullback to the middle of the 3-year trading range.
October is a weak High 1 bull flag
But what happens if November goes above the October high? That would trigger a High 1 buy signal.
However, a bear bar is a weak buy setup, especially when it is a 2nd consecutive bear bar. Also, the 5-month rally was climactic, which means the bulls might take profits soon. Finally, this pattern is at the top of a 3-year trading range. For 3 years, traders thought that the price was fair. If the Emini moves above that fair price range, it will tend to get pulled back into it.
Consequently, if November goes above October’s high, there might be more sellers than buyers up there. Unless November is a big bull bar closing near its high, traders will expect that the breakout will probably fail within a couple months. They will look to sell a reversal down.
The Weekly S&P500 Emini futures chart is reversing up from a double bottom bull flag
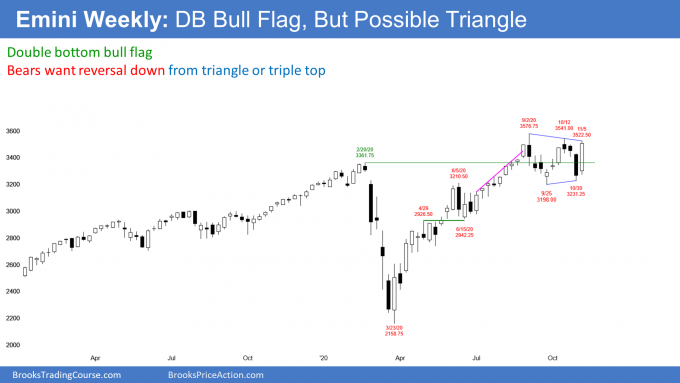
The weekly S&P500 Emini futures chart reversed up strongly this week after last week’s big bear bar. Traders see this as a reversal up from a double bottom with the September low.
A strong reversal like this typically has at least some follow-through buying. This is true even though the Emini is now at the resistance at the top of a 4-month trading range.
Will the bulls successfully break above the September high and get a 400 point measured move up to 4,000 based on the height of the 4-month trading range? The reversal up is strong enough to give the bulls at least a 50% chance of a new high.
However, the Emini is at the top of a 4-month trading range, which is at the top of a 3-year trading range. Trading ranges are magnets. That will tend to limit the extent of a bull breakout. The bulls have a 30% chance of the rally continuing up to 4,000 within the next several months.
Trading ranges resist breaking out
What is most likely over the next few weeks? Markets have inertia. They tend to continue to do what they have been doing. The Emini is at the top of a 3-year trading range. It is more likely that it will reverse back down into the middle of the range than break far above the range.
But there is no top yet and the momentum up is strong. Traders expect at least slightly higher prices over the next few weeks. Also, since this week reversed up strongly from a strong selloff last week, there will probably be at least a small 2nd leg up after the 1st pullback. Consequently, the Emini should be sideways to up for a few weeks, even if it pulls back next week.
The Daily S&P500 Emini futures chart has a climactic rally to top of the 4-month trading range
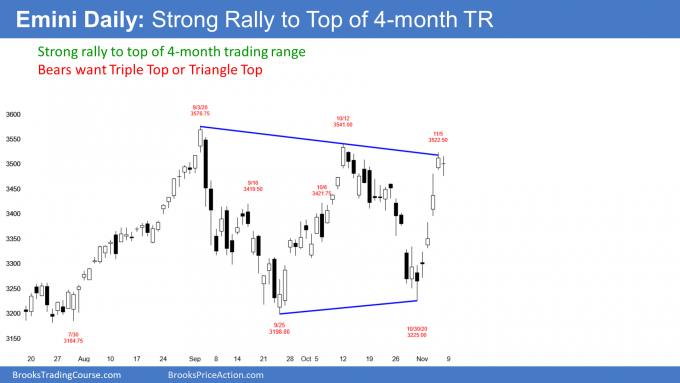
The daily S&P500 Emini futures chart rallied sharply from a higher low double bottom with the September 24 low. So far, the 6-day rally has not gone above the October 12 high, which was below the September 2 high.
A reversal down over the next few days would create a triangle. Traders would also view a leg down next week as a reversal down from a possible triple top. But until there is a breakout, there is no breakout. There is better than a 50% chance of a breakout to a new high before there is a breakout below the 4-month trading range.
A trading range is a Breakout Mode pattern
Since the Emini is already in a trading range, which is a Breakout Mode pattern, having it also be in a triangle does not change the math. It only becomes a triangle if there is a 2 to 3-day reversal down next week.
It would still be in a Breakout Mode pattern. There is generally about a 50% chance of a successful bull breakout and a 50% chance of a successful bear breakout. Also, there is a 50% chance that the 1st breakout will fail.
During the strong legs up and down, the probability is slightly greater for a breakout in the direction of the leg. But not much greater. Look at the strong rally up to the October 12 high. It reversed down. Then look at the collapse down to the October 30 low. It reversed up.
The legs in trading ranges always look like they will lead to a successful breakout. But reversals are always more likely, even though there will eventually be a successful breakout.
For traders to conclude that a breakout up or down is successful, they want to see a close far above or below the range. They then want a 2nd consecutive trend bar in the same direction also closing beyond the range. Only at that point does the probability go up for a continued breakout
High 1 bull flag
Friday pulled back below Thursday’s low. It is a High 1 bull flag buy signal bar for Monday.
However, the Emini is at the top of the triangle and failed to break above the bear trend line on Thursday. If it fails again on Monday, the Emini will probably pull back for at least a couple days. If the pullback is mostly sideways, traders will expect a break above the trend line and a test of the all-time high.
If instead the Emini triggers the buy by going above Friday’s high, but again fails to get above the bear trend line, Monday could become a sell signal bar for a micro double top and a 4-month triangle top. While that could lead to a week or two of selling, this week’s rally was strong enough to soon get above the bear trend line.
There is a 50% chance of a new all-time high in November. But how high can the Emini go? Since it is at the top of a 3-year trading range, it probably will not go more than a few percent higher before pulling back to the middle of the range.
Trading Room
Traders can see the end of the day bar-by-bar price action report by signing up for free at BrooksPriceAction.com. I talk about the detailed Emini price action real-time throughout the day in the BrooksPriceAction.com trading room. We offer a 2 day free trial.
Charts use Pacific Standard Time
When I mention time, it is USA Pacific Standard Time (the Emini day session opens at 6:30 am PST, and closes at 1:15 pm PST). You can read background information on the intraday market reports on the Market Update page.

