Monthly S&P500 Emini candle chart: Breakout of a small monthly bull flag
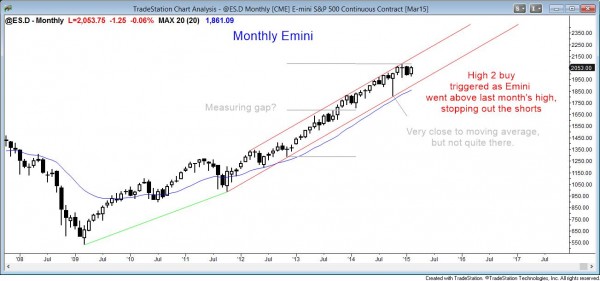
The monthly Emini candle chart triggered a sell this week by falling below last month’s low, but the stops for the bears were hit on Friday when the Emini reversed back above last month’s high. As it did so, it triggered a small high 2 buy setup, with the first entry being as December went above November’s high. This is a four month trading range in a strong bull trend, but it is overbought.
The monthly S&P500 Emini candle chart triggered a sell signal on Monday by trading below last month’s low. January was an ioi sell setup in an overbought bull trend. Although it was a good swing sell setup, the risk was small, which meant that the probability was low. Once the Emini traded above last month’s high today, the bears stopped themselves out. The bulls see this as a small double bottom bull flag, with the double bottom being this month’s low and December’s low. Every double bottom is a high 2 (ABC pullback) bull flag. Friday’s rally was a breakout of a small monthly bull flag.
Because the monthly chart is extremely overbought, a high 2 will probably be a final bull flag before there is a correction. However, the rally from the flag could last many bars, which means month. The chart is still extremely bullish, but because it is so overbought, it will probably have a 20% correction this year, and it can start at any time.
The first high-probability shorts in any strong bull trend are usually limit order scalps. This means that traders will begin to sell above bars, including buy setups, looking for scalps. They will use wide stops and scale in higher. Individual traders should not do this on a monthly chart because they would have to trade too small to make it worth the effort. However, I believe that institutions will start doing this.
Once there is a strong bear breakout, the probability for the bears goes up. If the breakout is strong enough, it can flip the market into a bear trend. When a bull trend is in a tight bull channel, like the Emini currently is, the first selloff is usually just a bear leg in what will become a trading range. Once there is another leg up, traders will begin to wonder if it will form a major trend reversal and be followed by a bigger correction (like the 20% one that I expect this year). Until then, all shorts are scalps, which means holding for a few bar.
On a monthly chart, a scalp is for a few months, and most traders do not use that term for monthly positions. Instead, they would say that it is for a trade. This is in contrast to an investment, which means a trade lasting 6 months or more, and it corresponds to a swing trade on the 5 minute chart.
Weekly S&P500 Emini candle chart: Tight trading range within a strong bull trend
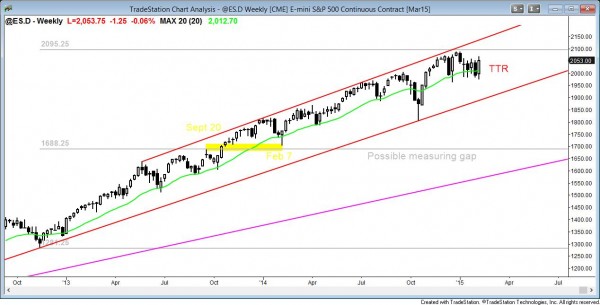
The weekly Emini candle chart reversed up strongly this week after last week’s close below the moving average. It is still in a 5 week tight trading range within a 3 month trading range in a bull trend.
The weekly S&P500 Emini candle chart is in a 5 week tight trading range, holding above the moving average. It is in a strong bull trend. A tight trading range late in a bull trend is often the final bull flag before a correction so traders will be quick to take profits if there is a bull breakout that begins to reverse down.
Daily S&P500 Emini candle chart: Breakout mode inside of a 3 month trading range that is within a broad bull channel
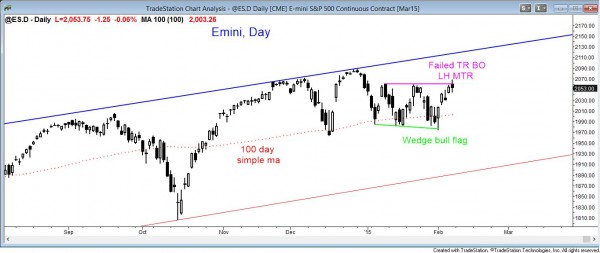
The daily Emini candle chart broke out of a wedge bull flag this week, but the bulls need follow-through. Otherwise, this will become another failed breakout in a 3 month trading range.
The daily S&P500 Emini candle chart is in a 3 month trading range and in breakout mode. The bulls had a strong rally this week from a wedge bull flag. The bears want this bull breakout to fail and create a lower high major trend reverse and then a bear trend. The market is still always in long (i.e., a bull trend), but as more bars get added to this trading range, the probability for the bear breakout becomes equal to that as for the bull breakout.
Traders can see the end of the day bar-by-bar price action report by signing up for free at BrooksPriceAction.com. I talk about the detailed Emini price action real-time throughout the day in the BrooksPriceAction.com trading room, and a 2 day free trial is available.
When I mention time, it is USA Pacific Standard Time (the Emini day session opens at 6:30 am PST, and closes at 1:15 pm PST). You can read background information on the intraday market reports on the Intraday Market Update page.


