Market Overview: Weekend Market Analysis
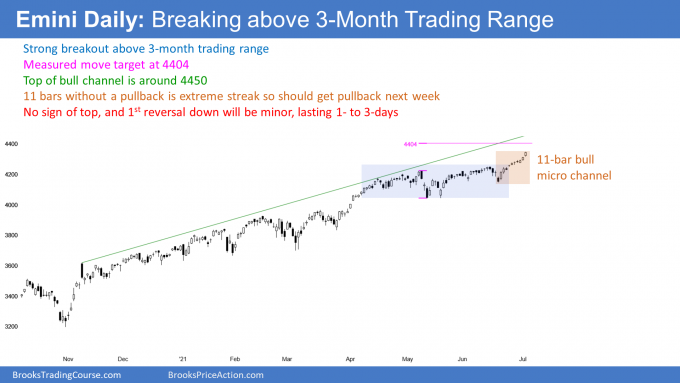
The SP500 Emini futures is breaking strongly above a 3-month bull channel in an extreme buy climax. The magnets above are the top of the bull channel and measured move targets. Since there have been 11 days without a pullback, there should be a brief pullback next week.
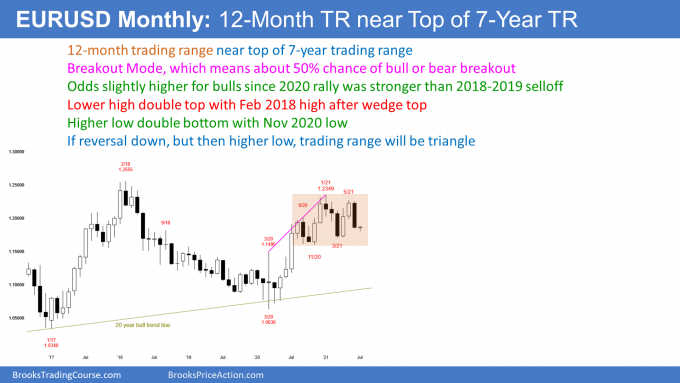
The EURUSD Forex market has been in a trading range for a year with no sign that it is about to end. If July reverses up, there will be a triangle. If July continues down, it will probably not fall far below the bottom of the range.
EURUSD Forex market
The EURUSD monthly chart

- June was big bear bar. It closed on its low and far below the May low.
- Reversing down from a lower high after last year’s wedge rally to a double top with the February 2018 high.
- Bears want a trend reversal. They hope for a break below the November low at the bottom of the yearlong trading range and then a measured move down to the 2017 low.
- But markets resist change, and the market is in a trading range. This selloff therefore will probably not break strongly below the November low.
- More likely, the trading range will continue, even if there is a small break below that low.
- Last month was a Bear Surprise Bar. But it is in a trading range, and therefore reversals are more likely than trends.
- There have been many big bull and bear bars over the past year. Every one reversed immediately or after one more bar. That is what is likely this time.
- That means there might be some follow-through selling in July, but July will probably not break strongly below the range.
- So far, July is reversing up from below the June low. If the reversal up continues, but forms a lower high, then there will be a triangle that began in November.
S&P500 Emini futures
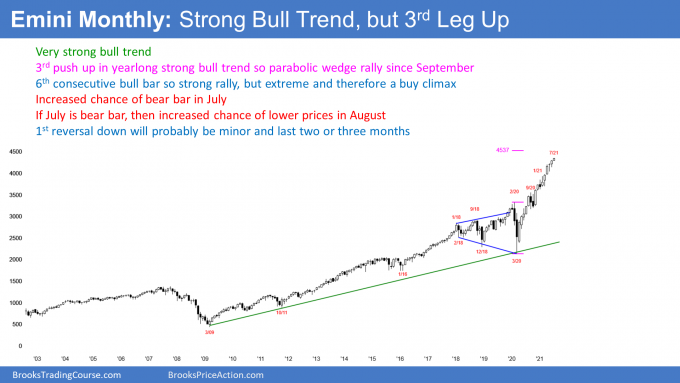
The Monthly Emini chart

- July gapped above the June high by 1 tick. Small gaps typically quickly close, and this one closed within the 1st few minutes of the month on Thursday.
- Next monthly target is measured move up at 4,537, based on height of pandemic crash (from February 2020 high to March 2020 low).
- June was the 5th consecutive bull bar. There have not been 6 consecutive bull bars since the pandemic low. That increases the chance that July will close below its open.
- If July has a bear body, July would be the end of a parabolic wedge rally (3 legs up in a tight bull channel) from the March 2020 low. That would probably lead to profit taking and a 2- to 3-month sideways to down pullback.
- Traders will buy that 1st pullback, and therefore it should be only a minor reversal in a strong bull trend.
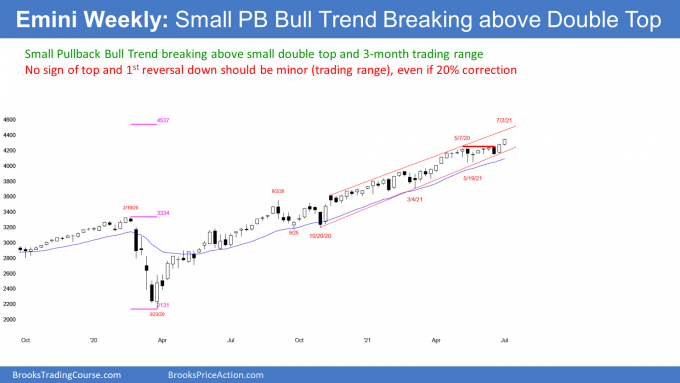
The Weekly S&P500 Emini futures chart

- Tight bull channel so strong bull trend. Next targets are the top of the bull channel and the measured move based on the height of the pandemic crash.
- Small Pullback Bull Trend for more than 60 bars, which is getting unusual. That increases the chance of the strong bull trend converting into a weaker bull trend.
- A Small Pullback Bull Trend ends with a big pullback. «Big» means bigger than any pullback in the Small Pullback Bull Trend. The biggest pullback was 10% and it lasted 2 months (September and October).
- Therefore, the strong trend will end once there is a 15 – 20% pullback. That pullback will probably last more than 2 months, and it will probably come this year.
- There is no sign that the pullback is about to begin, other than this trend lasting longer than most Small Pullback Bull Trends.
- Traders will buy the selloff, even if it is 20%. A 20% selloff is a bear «market.»
- But it will likely only be a pullback on the weekly and monthly charts, not a bear trend.
- A bear trend is a series of lower highs and lows, and it typically lasts at least 20 bars.
- While that could happen this year on the daily chart, it should not happen on the weekly or monthly charts.
- The best the bears can hope to get this year is a trading range for a few months.
- The low could be as much as 20% down from the high, but traders will buy it, expecting at least a test of the old high, which would be the top of the trading range.
- The bulls hope that the rally from the pullback low will be a resumption of the yearlong bull trend and not simply a test of the old high.
The Daily S&P500 Emini futures chart

- Strong rally from the June 18 low.
- 11-bar bull micro channel. That means every low was at or above the low of the prior bar. It is a sign of strong, relentless buying.
- It is also extreme and it will soon attract profit taking. Should be a 1- to 3-day pullback within next few days.
- Bulls will buy the 1st pullback.
- Bears typically need at least a micro double top before they can get more than a few days down from a micro channel.
Measured move target around 4,400
- Breakout above 3-month trading range.
- Several choices for top and bottom of range. Many computers will use May 7 high and May 12 low. Measured move up is 4,404.
- Top of bull channel is around 4,450, and it is also a magnet above.
- The strength of this breakout is similar to that of the early April breakout. Odds favor higher prices, even if enters a trading range, like after April’s strong breakout.
Trading Room
Traders can see the end of the day bar-by-bar price action report by signing up for free at BrooksPriceAction.com. I talk about the detailed Emini price action real-time throughout the day in the BrooksPriceAction.com trading room. We offer a 2 day free trial.
Weekly Reports Archive
You can access all weekly reports on the Market Analysis page.

