Market Overview: Weekend Market Update
The Emini continues to sell off with no sign of a bottom. It might have to test 2000 before a strong short covering rally will begin.
The bond futures market has pulled back from an extreme buy climax. Traders expect a trading range for several months.
The EURUSD Forex market made a new low in its 2 year bear trend. Consecutive bear bars closing below the February low make at least slightly lower prices likely.
30 year Treasury bond Futures market:
Reversal down from extreme buy climax
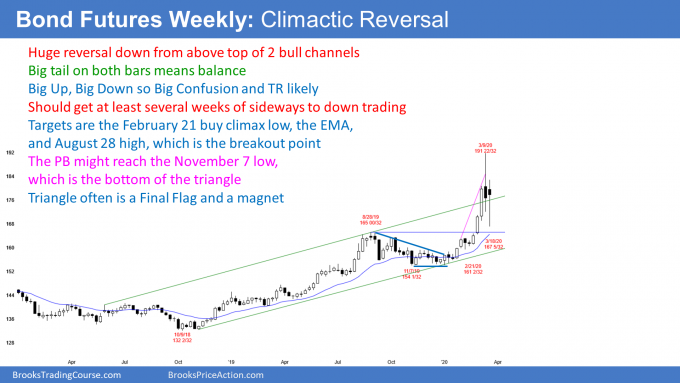
The 30 year Treasury bond futures market has pulled back for the past 2 weeks from its most extreme buy climax in history on the weekly and monthly charts. This reversal will probably continue sideways to down for a few months. Typical minimum objectives are 2 legs sideways to down and about 10 bars.
When there is a Big Up and then a Big Down move, there is Big Confusion. Traders look for reversals because they do not believe moves up or down will lead to trends. Consequently, traders should expect a trading range, possible for several months.
A reversal from a buy climax usually tests to the bottom of the most recent climactic rally. On the weekly chart, that is the low of those 3 big bull bars in the move up to last week’s top. That low is around 161. The top is usually around a lower high. On the daily chart (not shown), there was a lower high around 184. Consequently, the trading range might be between 160 and 185, which is huge.
If the likely trading range begins to form, many traders will look for fast money trades. This means the equivalent of scalps that last 1 – 5 bars (weeks, since this is a weekly chart). They will buy reversals up from just above 160 – 165 and sell reversals down from 180 – 185. They will then take profits around the middle of the range.
Can the 2 week pullback be a bull flag?
Trends continue much longer than what seems reasonable. However, at some point, something happens that makes it likely that the trend has paused or ended. This strong reversal down from the extreme buy climax is enough to end the bull trend, at least for about 10 bars and 2 legs sideways to down.
At that point, if the bears have been unable to create a trend down, the bulls will start to buy again. They want the pullback to be a pause in the bull trend instead of the end of the trend. The bull trend probably will not attempt to resume up to a new high for at least a couple months.
Buy climax also on the monthly chart
The buy climax is also extreme on the monthly chart. If this month closes below the open, it will be a bear reversal candlestick on the monthly chart. Traders will then look for about ten bars and 2 legs sideways to down on that chart as well. That means about a year. The target on that chart is the bottom of the most recent climactic leg up. That is the January low around 154.
EURUSD weekly Forex chart:
Break to new low in 2 year bear trend
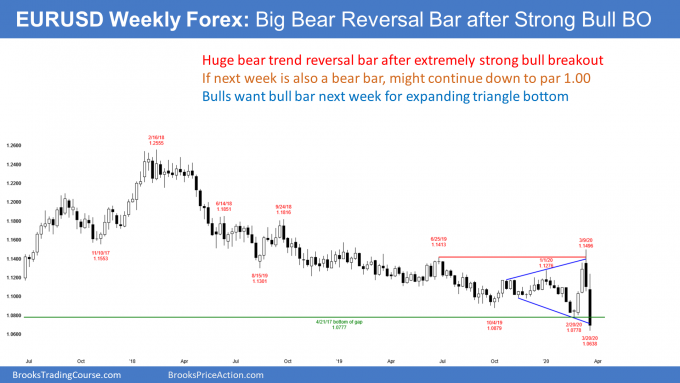
The EURUSD weekly Forex chart collapsed over the past 2 weeks after breaking above the 2 year bear channel. For the past year, I have mentioned many times that there was a gap above the April 7, 2017 high and that it was a potential magnet. The EURUSD low in February was 1 pip above the bottom of the gap.
There was then a strong rally to above the 2 year bear channel. Traders correctly concluded that the gap was successfully tested and the bear trend had ended. The weekly chart was either in a bull trend or a trading range as of 2 weeks ago.
With this week falling below the February low, the EURUSD made a new low in its 2 year bear trend. But it could also still be forming a slightly lower low in its 8 month trading range. If there is a strong reversal up within a couple weeks, the EURUSD would be back to the middle of its 8 month trading range. It would therefore be more neutral, although slightly bearish after this week’s new low.
It is important to note that if the EURUSD weekly chart next week has a bear body and a 2nd consecutive close below the February low, traders will expect a 2nd leg down after the first 1 – 3 week bounce.
Furthermore, they will look for the selloff to reach the next support. That is the January 2017 low of 1.0340. If the EURUSD broke below that, the next support is at par (1.00).
Is this week’s bear break a bear trap?
What if next week’s candlestick has a bull body closing above the February low, or even at the high of the week? Traders will then suspect that this week’s breakout might fail. It might be a bear trap and the 3rd leg down in an expanding triangle. The 1st two bottoms were the October and February low.
Any triangle is a trading range. Therefore, even though the EURUSD broke below a horizontal trading range, it is still possibly in an expanding triangle, which is also a trading range. However, on the daily chart (not shown), both Thursday and Friday were bear bars that closed below the February low. That makes at least slightly lower prices likely next week.
If the bulls next week get 1 or 2 bull bars on the daily chart, especially big bull bars closing near their highs, traders would suspect that the March breakout was a bear trap and the the 8 month trading range was still intact. That rally would reduce the chance of a move down to par.
At the moment, the odds favor lower prices. They will change depending on what next week does.
Impact of Coronavirus pandemic
Last month, when there were not even 100 cases of coronavirus in the US, I said that it was going to be a huge disaster. I said that between 30 and 60% of the country would probably be infected and that millions could die.
Although I am an eye surgeon, I had a subspecialty that included infectious diseases. I did not see how a pandemic was avoidable. The early data showed that the average patient infected 3 people and that the number of cases was doubling every 3 – 6 days. If you do the math, that means 1 person, then 3 people, then 9, etc. Within a few months, that exponential growth meant millions of infections.
Furthermore, there is no effective treatment and a vaccine is at least a year a way. That is why I said that 3 billion people worldwide could ultimately be infected and this was probably going to be the worst pandemic since 1919.
Herd immunity
Life is going to change again in a month or two. The number of infections in the US will soon be in the millions and probably tens of millions. The odds are very high that a person cannot catch it again. Therefore, all of those people who recovered will be immune. They will no longer have restrictions because they cannot catch it and cannot spread it.
Once we reach some magic number of recovered patients, there will be fewer people to spread the virus. This is called herd immunity. For many virus outbreaks, true herd immunity, enough to prevent an epidemic, is about 95% of the population. That is not going to happen with the coronavirus. But once about 10% of the population recovers and is immune, restrictions will get less for everyone. This will continue to improve until there is a vaccine. At that point, life will be back to normal.
I think it is helpful to look at the Spanish Flu pandemic of 1919. It began in the spring. As summer came, the number of new cases started to shrink. People thought the pandemic ended. But then in the fall, the flu returned and was as bad as it was in the spring. Yes, I think the immediate crisis will be getting a little better by the end of May. But it is a mistake to assume that the pandemic has ended until after there is a vaccine next year.
I want to make one final point. Everyone assumes there will be a vaccine, like for the flu and measles. It is important to remember that there is no vaccine for HIV, which is a virus. While unlikely, scientists might discover that they cannot create an effective vaccine for the coronavirus either.
Many heroes
I think that the governors have been bold, courageous, and proactive. They have done a great job in leading us through this and creating our path forward.
Unfortunately, their isolation plans will not stop the inevitable. About half of all Americans will get infected. But their plans will slow the growth rate and that will save lives. There are not enough ventilators to treat a surge in patients. If the healthcare system gets overwhelmed like it did in Italy, far more people will die.
I want to also say that many people are doing great things to help all of us. Farmers, truckers, grocery and pharmacy store workers, everyone at any medical facility, anyone whose job requires them to be exposed to the public, and even all of the Americans who are simply doing their jobs and trying to avoid getting infected, and especially trying hard to not infect others.
There has not been a national challenge like this since World War II. It was easy to assume that we did such a great job building our society that we would never face a national crisis of this scale. Life humbles everyone at some point, including societies that have enjoyed their hubris. But despite the hardship, it is nice to be reminded of how good people can be.
Economic impact: We are in a recession
There are many ways to determine if an economy is in a recession. The most widely used is to look at the GDP growth rate. If it falls for 2 consecutive quarters, the economy is shrinking. The news will declare that we are in a recession. But that diagnosis comes about 6 months after the recession began.
We see that the economy is shrinking. Everyone has cancelled hotel, air, and cruise reservations, and no one is going to restaurants or the mall. Consumer spending is way down and millions of people are getting laid off. Unemployment could reach 10% or more. We are in a recession. The country is making much less money and there is no reason to think that it will expand again for many months.
America is still in shock. This will last for a couple more months. When do we know that a big bear rally will begin? I will use toilet paper as a barometer. When Walmart and Costco start having toilet paper again, then America is less scared. That should lead to a bear rally, which could last many months.
A bear market has consequences that last a long time
The S&P entered a bear market last week when it closed 20% below the all-time highest close. When there is a bear market, the final low typically comes about a year later. If there is a strong rally within the next couple months that is similar to the one in 2019, traders will assume that it will form a lower high. It will not be a resumption of the bull trend. Expect at least one more new low in about a year.
In addition, that new low will probably be 40 – 50% below the old high. That means there would have to be a 50 – 100% rally to get back to the old high. On average, it takes 2 years to get to the old high.
However, I talk about some technical factors below that are problems for the bulls. The economy will probably be stagnant for a decade. It will be difficult for the market to get much above the current high for many years.
There are bigger problems than the pandemic
I keep making the point that the 2017 extreme buy climax and the chaos over the last 2 years meant that the economy had very serious problems. This is true despite stock pundits and politicians continuing to claim the market would continue a lot higher. The market was telling us for 2 years that it believed the late stages of the rally were created by unsustainable manipulation rather than corporate earnings. The government and industry could not figure out how to continue the fake bull trend.
The pandemic was the straw that broke the camel’s back. But that poor camel was already carrying too much and it was just a matter of time before its back was going to break.
The pandemic will be over in about a year, but then what?
You hear politicians and economists say that the economy is strong and it will roar back as soon as the pandemic ends within a year. That is because they do not know how to read charts.
Yes, in a few years, the coronavirus will no longer be a problem. Suppose that I am right and the stock market is unable to make a significant new high for many years. I bet it will be a decade. What then will the experts say?
They will look back at today and come up with all kinds of reasons to explain that the 12 year bull trend was not based on strong fundamentals. Many will claim that everyone knew that the economy was actually weak, despite the strong stock market. They will explain it by pointing to the Fed’s interventions, stock buybacks, low interest rates, and just about anything else imaginable.
I have a simpler explanation. The most extreme buy climax in history should lead to a decade long trading range, just like every other extreme buy climax did. The charts told us that price got too far ahead of fundamentals. That is the only absolutely certain fact. Any other explanation is sophistry.
Price is truth
There were countless factors that contributed to the buy climax, but who cares? It is impossible and useless to know how much each factor contributed to the buy climax. I’m in this for the money. Those discussions do not help me achieve my goal. All I am interested in is what the charts are saying. Price is truth.
The market will be a trader’s market for a long time, which means it will disappoint buy and hold investors. It will take a decade before the fundamentals catch up to price, allowing the bull trend to resume.
Yearly S&P500 Emini futures chart: Outside down
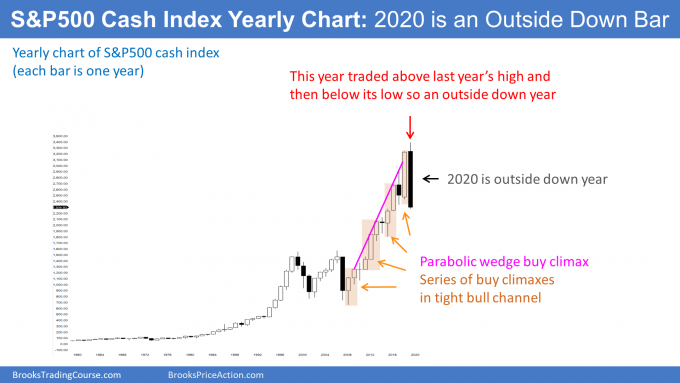
On a yearly chart, each bar is one year. Last year was an extremely big bar and it came late in a bull trend. In my final weekend report of 2019, I said that it was probably going to be the end of the bull trend or that there might be one more brief new high and that would be the end. I wrote that there was a parabolic wedge buy climax on that chart and that it would probably lead to a decade of sideways trading.
This year traded above last year’s high. It has now also traded below last year’s low. Consequently, 2020 is an outside down bar on the yearly chart. That is a sell signal bar for next year. It will have a higher probability of leading to lower prices if this year closes near its low and below the 2019 low.
What happens after an outside down bar?
When there is a big outside down bar (here, year), usually the next year is not a big bear bar. This is especially true when it comes in a strong bull trend, like we’ve had since 2009. More often, it trades below the low of the outside down bar to trigger the sell signal, but it becomes a weak entry bar. If it closes near its high, it is a High 1 buy signal bar for the next year.
Sometimes the bar after an outside down bar is an inside bar. That means that next year’s low would be above this year’s low and its high would be below this year’s high. There would then be an ioi pattern (inside-outside-inside), which is a Breakout Mode pattern. The entry up or down would come in the following year, which would be 2022. This is getting too far ahead, but it is helpful to think about it.
There is one other point to remember. If 2021 is an inside bar, or if it trades below this year’s low and then rallies, it will overlap a lot of this year’s range. In both cases, there would then be 3 sideways bars on the yearly chart.
I have made the point repeatedly over the past 2 years that the stock market will probably be in a trading range for about a decade. Three sideways bars is the start of a small trading range.
Monthly S&P500 Emini futures chart:
Break below 2 year trading range and 11 year bull trend line
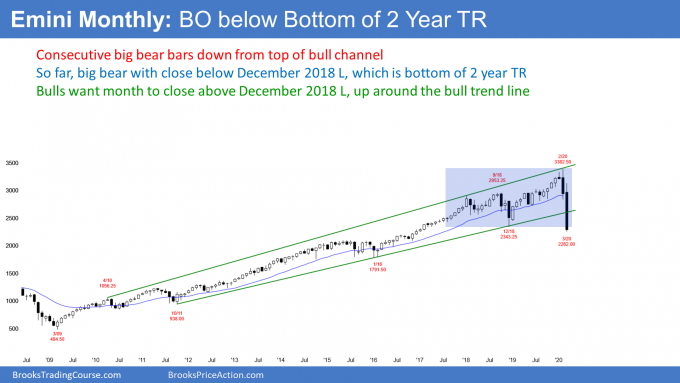
The monthly S&P500 Emini futures chart this month so far has a big bear body. It has broken below the 11 year bull trend line and the bottom of the 2 year trading range.
There are 7 trading days left in March. They can change the appearance of this month’s candlestick. Depending on how the month closes, April could be bullish or bearish.
The bull trend line is currently around 2600. If the bulls get a reversal up to above that trend line, there would be a big tail on the bottom of the March candlestick. While consecutive big bear bodies make a 2nd leg sideways to down likely, a big tail reduces the chance of a big selloff in April. Traders will wonder if the Emini was finding support at the December 2018 low. That is the bottom of the 2 year range.
A big tail would reduce the chance of April falling below the March low. Furthermore, it would increase the chance of the Emini trading sideways to up for the next month or two.
Traders saw the 11 year bull trend line and that December 2018 low as major support. Also, the stock market often bounces when it falls 10, 20, 30, or 50%. These numbers are therefore additional support. A 30% selloff is particularly important because that is the average lowest selloff when the Emini enters a bear market.
Emini testing major support
The lowest close this week for the S&P cash index was on Friday. It was 32% below the all-time highest close of February 19. That is about a 30% correction. Consequently, this week tested all 3 support levels (the bottom of the 2 year trading range, the 11 year bull trend line, and a 30% pullback level).
Traders are deciding it the bears will begin to cover their shorts around the current support and if strong bulls will start to buy, expecting a short covering rally. If there is strong short covering, this month could close back above the bull trend line, which is around 2600.
If the month closes on its low, it will also close below the December 2018 low. Traders would see that low as a breakout point. Since the 2 year trading range is about 1000 points tall, they will wonder if there would be a measured move down to around 1300.
That would be a 62% correction. There is only a 20% chance of that at the moment. The best the bears can probably get before a short covering rally is a test of the bottom of the 2014-2015 trading range at around 1800. That would represent almost a 50% correction. There is a 30% chance of the Emini reaching that before there is a bear rally.
Weekly S&P500 Emini futures chart:
Testing the price at the start of President’s Trump’s term in office
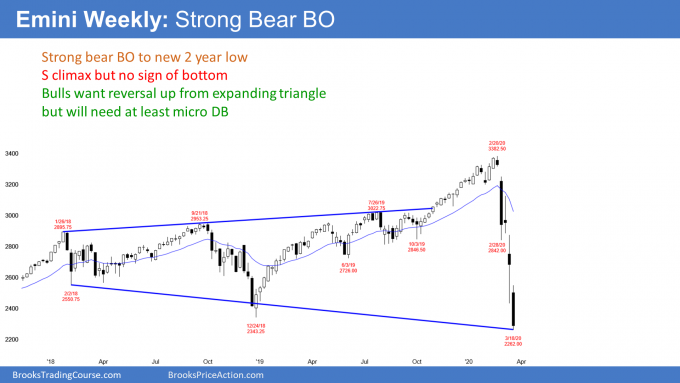
The weekly S&P500 Emini futures chart formed its 5th consecutive big bear bar this week. Furthermore, it closed below the December 2018 low, which was the bottom of a 2 year trading range.
If the bulls get a reversal up within the next few weeks, that low would be the 3rd leg down in an expanding triangle. The 1st two are the February and December 2018 lows. Traders would then expect a rally back to at least the middle of the 2 year triangle. That would retrace about half of the bear trend.
Daily S&P500 Emini futures chart:
Small Pullback Bear Trend
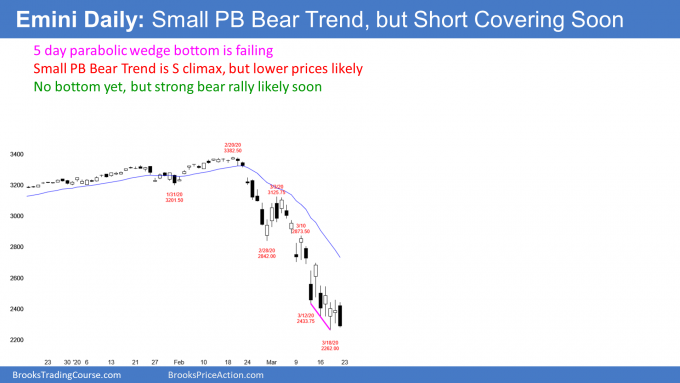
The daily S&P500 Emini futures chart is in a sell climax. Sell climaxes can fall far further than what seems reasonable. There is no reversal up yet. Traders on Wall St. sometimes say something like, «Being cheap is a bad timing tool.» Just because the market seems cheap, it can get much cheaper, and it is not necessarily a good time to buy. In fact, when the market collapses, it still might actually be expensive based on the new economic conditions. You will know in hindsight if it falls a lot more.
The first leg down was a huge break below the 4 month bull trend line on the daily chart. It was a spike down to the February 28 low. There was then a 3 day pullback to the March 3 high and then a resumption of the bear trend.
The March 3 high was the start of a parabolic wedge bear channel. That is a tight bear channel with at least 3 pushes (sell climaxes) down. This selloff had 5 brief legs down. The last 3 were over 5 days and formed a micro wedge bottom. It was nested into the end of the 2 week parabolic wedge sell climax. A nested wedge selloff has a higher probability of leading to a reversal up.
Reversing all of the gains of the Trump Presidency
The Emini dipped below the January 20, 2017 open on Wednesday and reversed up. On Friday, it fell below it again, but closed just a little bit above. That was the start of the Trump presidency. Therefore, the stock market has almost erased all of its gains since President Trump took office. The cash index has not quite reached its open from that day. Trades can read into it whatever they want, but the market is clearly paying attention to the start of his presidency.
Bulls want signs of buying pressure
While this week had several bull days, they all had small bodies. Also, there were no consecutive big bull bars closing on their highs. Traders want to see that before concluding that a short covering rally is underway. The bears who did not yet buy back their shorts will buy in a panic. The bulls will buy as well.
Both the bulls and bears know that a short covering rally in an extreme sell climax typically has at least a couple legs sideways to up. They also expect it to last about 10 bars or more.
Because this selloff was particularly severe, the short covering rally could last a lot longer than 2 weeks. A logical target would be around 3000. That is a Big Round Number and it was resistance several times in 2018 and 2019.
Can this be a V bottom, like in January 2019?
No. First of all, only about 20% of sell climaxes immediately reverse up into a bull trend. Therefore V bottoms are rare, which means that any upcoming bottom will probably not be like the one from last year.
If the upcoming short covering rally will not be the resumption of the 12 year bull trend, what will happen? There might be a rally for a month or two that would be a credible start of a V bottom reversal. However, there is an 80% chance that the rally would be minor. A minor reversal is one that does not lead to an opposite trend.
It is either a bull leg in a trading range or a bear flag. In either case, traders should expect a test of the bottom of the current sell climax. When there is a test, there is often a rally from a double bottom. That has a 40% chance of beginning bull trend.
Extreme buy climaxes lead to extreme trading ranges
This month-long selloff is extremely strong. It is similar to the 1st leg down in the 1929 Crash. There was then a 2nd leg down. And then a 3rd, and many more legs down. The bear trend did not end until the stock market lost almost 90% of its value. While there might be a wedge selloff (3 legs down) over then next year and the market will probably lose at least 40% of its value, it will not lose 90%.
Starting at the end of 2017, I repeatedly said that the late 2017 rally was the most extreme in the 100+ years of the stock market. I said that it would lead to a pullback for many months. But I also said every pullback was just that, which is a pause in a bull trend. Traders should expect higher prices to follow every pullback. Additionally, I said many times that the buy climax was coming late in a bull trend and that there would probably be a major top within a few years.
Finally, I often compared it to the rallies in the 1960’s and 1990’s. Both led to trading ranges that lasted about 10 years. Each also had at least a couple pullbacks of 40% or more. I therefore said that the 2020’s would probably be in a trading range for a decade and that there would be at least a couple 40 – 50% pullbacks.
Trading range likely to last about a decade
This selloff is a likely start of a decade long trading range. The bulls typically get a new high about 2 years after a bear trend ends. On average a bear trend lasts about a year. Consequently, there might be a new all-time high in about 3 years. However, it will probably not get far above this February’s high. It would just be a bear leg in a developing 10 year trading range. Traders should then expect another 40+% selloff from that high.
What to expect next week
The daily chart is in a parabolic wedge sell climax. That is also a Small Pullback Bear Trend. There is no sign of a bottom. Traders continue to expect lower prices.
The next target is the 2000 Big Round Number. But a strong short covering rally can begin at any time. You will know it when you see it because the buying will be obvious and relentless. Until then, the bear trend will still continue down.
Trading Room
Traders can see the end of the day bar-by-bar price action report by signing up for free at BrooksPriceAction.com. I talk about the detailed Emini price action real-time throughout the day in the BrooksPriceAction.com trading room. We offer a 2 day free trial.
Charts use Pacific Standard Time
When I mention time, it is USA Pacific Standard Time (the Emini day session opens at 6:30 am PST, and closes at 1:15 pm PST). You can read background information on the intraday market reports on the Market Update page.

