Weekend report co-author Andrew A.
Market Overview: Weekend Market Analysis
SP500 Emini consecutive bear bars testing several support levels ahead of the FOMC statement report on September 22, which can be a catalyst for a big move in either direction. September or October should be a bear bar on the monthly chart and the start of a 15 – 20% correction. There is a 50% chance that it is underway.
The EURUSD Forex is selling off from a double top bear flag. The bears are looking for a resumption of the bear trend to below the November 2020’s low, followed by a 700-pip measured move down based on the height of the yearlong trading range. However, the current sell off is more likely is a bear leg in the 4-month trading range, and there should be buyers below August or November’s low.
EURUSD Forex market
The EURUSD weekly chart
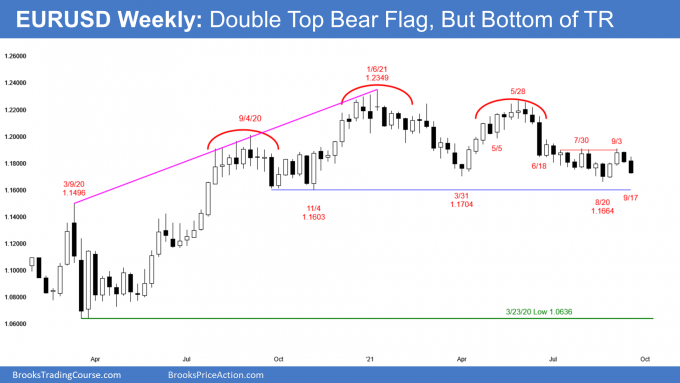
- This week’s candlestick on the weekly EURUSD Forex chart was the 2nd consecutive bear bar closing near its low.
- The bears got the follow-through bar they needed from last week’s bear inside sell signal bar reversing from a double top bear flag.
- Because of the strong bear close, odds favor at least slightly lower prices next week. The selloff will probably continue down to the August low.
- The bears are hoping for a resumption of the May to August bear trend to below the November 2020 low, followed by a 700-pip measured move down, based on the height of the yearlong trading range.
- The bulls are hoping for a double bottom major trend reversal, even if the low is slightly below August or November’s low.
- A reversal up from below the March low would also be a wedge bull flag with the March and August lows.
- If the EURUSD re-test the August or November’s low, odds are there will be buyers around the lows of the yearlong trading range.
- Most breakouts from trading ranges fail. Markets have inertia and tend to continue what they have been doing.
- Therefore, the yearlong trading range is likely to continue, even if there is 1st a dip below the bottom. That means there should be buyers around the August or November’s low.
The EURUSD daily chart
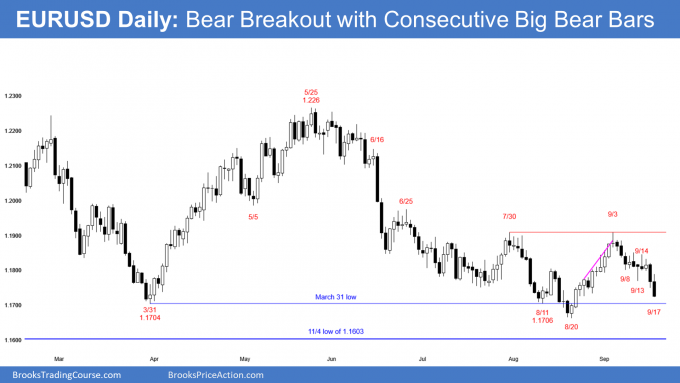
- The EURUSD Forex daily candlestick chart has consecutive big bear bars closing near their lows.
- This is a Bear Surprise breakout below the September 13 attempt at a High 2 bottom, and it should have at least a small 2nd leg down. Traders will sell the 1st 1- to 2-day bounce.
- As strong as the current sell-off is, a double top bear flag (July 30/September 3) near the bottom of a trading range only has a 40% chance of a break below the neckline (here, the August low) and a measured move down (the double top is about 200 pips tall).
- Consecutive closes below the August low will shift the probability in favor of the measured move down.
- It is currently more likely just a bear leg in a trading range and a sell vacuum test of the trading range lows.
- Buy/sell vacuum tests of support and resistance are common in a trading range.
- Sell vacuum tests happen because bulls step aside and are only willing to buy at major support, while the bears are shorting aggressively, confident the selloff will reach that support. However, once EURUSD reaches its target, the bears start to take profits aggressively and the bulls return to buy.
- The bears want a test of the November 2020 low, followed by a 700-pip measured move down based on the height of the yearlong trading range.
- The bulls want a double bottom major trend reversal, even if EURUSD trades slightly below August or November’s low.
- Most breakouts from trading ranges fail. Markets have inertia and tend to continue what they have been doing.
- That means there should be buyers around the August or November’s low.
S&P500 Emini futures
The Monthly Emini chart
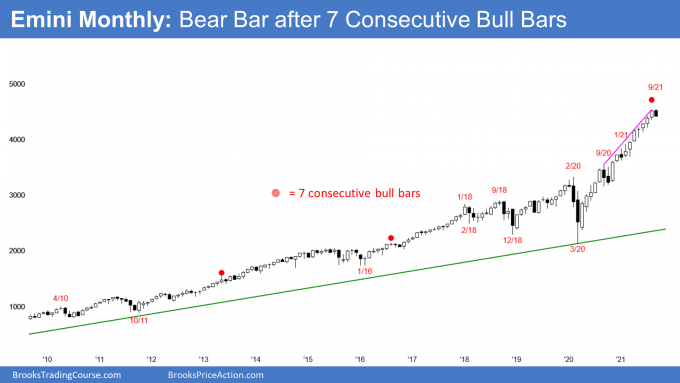
- The candlestick on the monthly Emini chart so far is a big bear bar closing on its low. It is the first bear bar after a streak of 7 consecutive bull bars and the possible start of a 2- to 3-month correction.
- August was the 3rd time in the 25-year history of the Emini when there was a streak of 7 consecutive bull bars. On the monthly chart of the S&P500 cash index, there have only been 6 times in over 60 years when there was a streak of 8 bull bars. There has not been a streak of 9 bars in that time. September or October should be a bear bar on both monthly charts.
- If September or October is a bear bar, it should lead to a 2- to 3-month correction of 15 to 20%. Look at the chart. You can see that this is what typically happens after a bear bar in a buy climax.
- The odds of a correction increase if the bear bar has a big bear body and closes near the low.
- The bulls want the Emini to close above the middle of the bar with a long tail below. They prefer a close above the open of the month, but that is about 100 points away.
- While the current candlestick is a big bear bar, there are 9 more trading days left in the month and the appearance of the bar can be different by the end of the month. This is especially true with the September 22 FOMC statement being a potential catalyst for a big move in either direction.
The Weekly S&P500 Emini futures chart
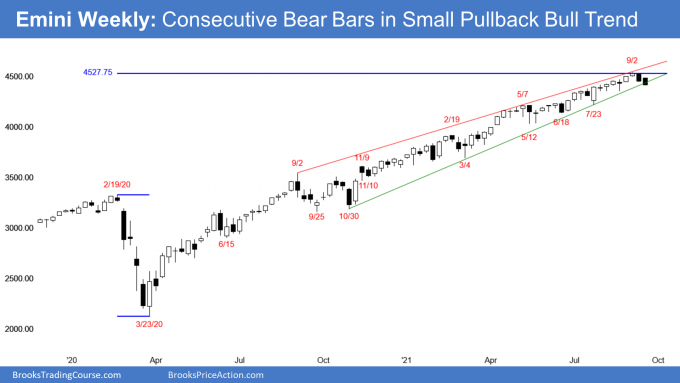
- This weekly Emini candlestick chart has the 1st pair of big bear bars closing on their lows since the pandemic crash. This week also closed below the bull trend channel. There is a 50% chance that a 15% correction has begun.
- Because the Emini closed near the low of the week, next week could gap down, creating a gap on the weekly chart.
- Bears need to see follow-through selling and a close near the low next week to convince other traders that a 2-legged sideways to down correction of at least 15% is underway. Traders will see it as a sign that the bulls are starting to take profits aggressively.
- If the bears get that, it would be 3 consecutive bear bars on the weekly chart, something that has not happened since the pandemic crash and would bolster the bear’s case.
- The bulls want next week to be a bull bar closing near its high and for the breakout below the trend line to fail. The bulls know that in a strong trend, most reversal attempts fail and are hoping that it will be the same again this time.
- There is a 50% chance that September 2 will remain the high for the rest of 2021. Since there is a 50% chance that the September 2 high will be the high of the year, there is a 50% chance that a 15% correction is underway.
- A 50% chance of September 2 being the high of the year means a 50% chance there will be a new high.
- The Emini has been in a Small Pullback Bull Trend for more than 60 bars, which is unusual, and therefore unsustainable and climactic.
- Traders will conclude that the Small Pullback Bull Trend has ended once there is a big pullback. The biggest pullback so far was the 10% selloff in September 2020. A bigger pullback typically means 15 to 20%, and that is why the correction should be at least 15%.
The Daily S&P500 Emini futures chart
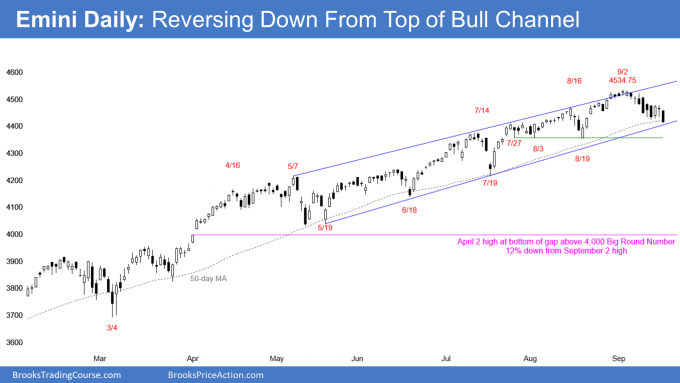
- Friday’s candlestick on the daily Emini chart closed below the 50-day moving average and just above the bottom of the bull channel.
- Because the Emini closed near the low of the week, next week could gap down below the bull trend line and 50-day moving average.
- If the bears get consecutive bear bars closing on their lows and below these support levels, traders will conclude that the correction is underway.
- A correction typically is about half over by the time traders believe it is taking place.
- The next target for the bears is the August 19 low.
- If this is the start of a 15% correction, a possible target for the bears is the April 2 high at the bottom of the gap up above the 4000 big round number. That would be 12% down from the September 2 high.
- The move down since September 2 is in a tight bear channel but with many overlapping bars. The overlapping bars mean that the bears are not yet as strong as they could be. However, since it is in a tight bear channel with many consecutive bear bars and big bear bars, there should be a second leg sideways to down after any pullback (bounce).
- There is a 50% chance that September 2 will remain the high for the rest of 2021.
- Since there is a 50% chance that the September 2 high will be the high of the year, there is a 50% chance that a 15% correction is underway. If it is, there could be a collapse below the 50-day moving average and bottom of the bull channel before there is a new all-time high.
- Therefore, there is an increased chance of a big selloff at any time. For example, next week might gap down below the 50-day moving average and the bull channel, or the Emini could sell-off on Wednesday’s FOMC announcement.
- A 50% chance of September 2 being the high of the year means a 50% chance there will be a new high.
- With the Emini at the 50-day moving average and just above the bull trend line, the bulls are hoping for another reversal up, like after every prior test of the 50-day moving average since the pandemic crash.
Trading Room
Traders can see the end of the day bar-by-bar price action report by signing up for free at BrooksPriceAction.com. I talk about the detailed Emini price action real-time throughout the day in the BrooksPriceAction.com trading room. We offer a 2 day free trial.
Weekly Reports Archive
You can access all weekly reports on the Market Analysis page.

