- Market Overview: Weekend Market Analysis
- 30-year Treasury Bond futures
- Bond futures on weekly chart are at the apex of a triangle, with equal chance of a bull or bear breakout
- EURUSD Forex market
- EURUSD weekly chart is in bull trend, but might be starting minor reversal down from nested wedge top
- S&P500 Emini futures
- Yearly Emini Chart has big outside up bar
- Monthly Emini chart has follow-through buying after November strong breakout
- Weekly S&P500 Emini futures chart in Small Pullback Bull Trend, but possible micro wedge and minor reversal down soon
- Daily S&P500 Emini futures chart in Small Pullback Bull Trend, but Late in Bull Channel
Market Overview: Weekend Market Analysis
The SP500 Emini futures chart closed 2020 at a new all-time high. That increases the chance of a gap up next week on the daily, weekly, monthly, and yearly charts. However, if there is a strong rally in early January, it will probably soon lead to a profit-taking pullback down to 3500.
Bond futures on the weekly chart are at the apex of a 10-month triangle. There should be a breakout in January. There is a 50% chance that it will be up and a 50% chance it will be down.
The EURUSD Forex has rallied strongly since March, but there is a nested wedge top. That often leads to profit taking. This week’s bear outside down bar might be the start of a pullback to the November low at around 1.16.
30-year Treasury Bond futures
Bond futures on weekly chart are at the apex of a triangle, with equal chance of a bull or bear breakout
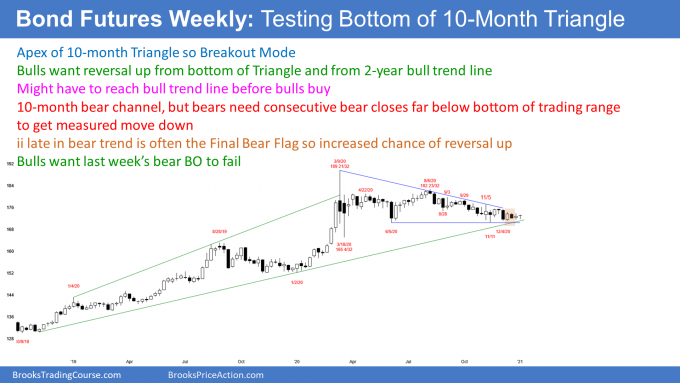
The weekly bond futures had a high this week that was below last week’s high, and a low that was above last week’s low. This week therefore was an inside bar on the weekly chart. That is a Breakout Mode pattern, which means it is both a buy and sell signal bar for last week.
It is important to note that last week broke below an ii Breakout Mode pattern (consecutive inside bars). If the coming week goes above the top of the ii, which is the high from 3 week’s ago, last week’s ii sell signal will have failed. Additionally, that ii is still a Breakout Mode pattern. If this week goes above it, not only does it end the sell signal, but it triggers a buy signal.
The weekly bond chart is at the apex of a 10-month triangle, which is a Breakout Mode pattern. It is also in a 4-week tight trading range that is within a 9-week tight trading range. Those are also Breakout Mode patterns.
While the bond market has been trading down in a tight bear channel for 5 months, it has been going sideways for 2 months at the bottom of the 10-month triangle (trading range). Traders should assume that the chance of a bull breakout is the same as for a bear breakout.
Deceptive math for breakout traders
Traders expect a 4-point measured move up or down, based on the height of the 2-month trading range. With the bonds hovering in the middle of the range, a bull could buy and risk about 2 points to just below the bottom of the range. He could hold for 2 points to the top, and then 4 more points for a measured move up. It appears he is risking 2 points to make 6 points on a 50-50 bet.
The opposite is true for a bear. He can risk 2 points to above the range, trying to make 6 points.
Since it is Breakout Mode, isn’t the probability 50%? If so, that is a great trade for both the bulls and the bears. If either takes it 10 times, he loses 10 points (5 losses out of 10 trades for 2 points each) and makes 30 points (5 wins of 6 points). Why not either buy or sell in the middle of the range?
What did I not say about Breakout Mode?
The answer is that you did not read my words carefully enough. Traders believe that a Breakout Mode pattern has about a 50% chance of reaching approximately a measured move up or down, which is true. However, there is one other point that I always make, but I did not make yet. That point changes the math.
Here it is… there is a 50% chance that the 1st breakout up or down will fail. Therefore, if a bull buys, there is a 50% chance he will get stopped out only to have the market continue in the range, or resume back up without him. If a bear sells, he has a 50% chance of being stopped out on a failed bull breakout, and then watching the market either continue sideways, or break to the downside. There are often two or more failed breakouts before one succeeds (reaches a measured move target).
Therefore, traders do not believe it is as simple as taking a bet with 1:3 risk/reward and 50% probability. It could not be that way for both the bulls and bears, and therefore it is not that way for either. That would be close to a perfect trade. No one would take the other side, and, consequently, the trade cannot exist.
Breakout Mode means traders want more information
Once there is a consensus about direction, the market races in that direction. Why isn’t the bond market crashing after selling off since the March high? Because traders believe it is neutral. The math is about the same for the bulls and bears.
Everyone expects a breakout soon, but experienced traders know there is a 50% chance that the breakout will reverse. Those traders will watch the breakout. If it looks strong, they will trade in that direction. If it looks like it might reverse, they will be prepared to enter in the opposite direction.
EURUSD Forex market
EURUSD weekly chart is in bull trend, but might be starting minor reversal down from nested wedge top
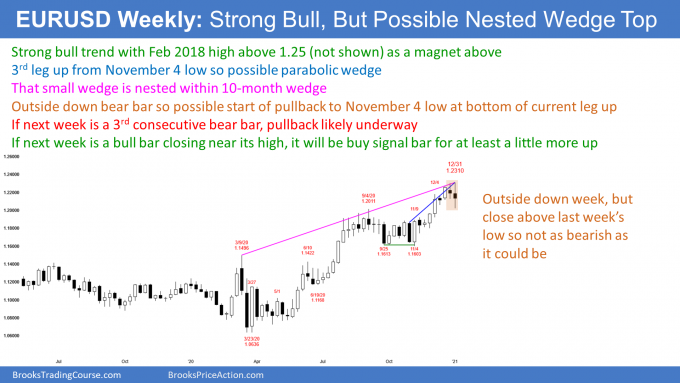
The EURUSD weekly chart formed an outside down bar this week, and it had a bear body. However, it closed above last week’s low and far above the low of the week. Consequently, it is less bearish than it could have been. However, since there is a nested wedge top, which I will discuss below, the EURUSD has probably begun a pullback. Traders should expect it to trade sideways to down for several weeks.
The EURUSD rallied strongly from the November 4 low. That rally is the 3rd leg up from the March low. Once a bull channel has 3 legs up, traders start to look to take profits. It does not matter that the rally does not have a textbook wedge shape. Three pushes up in a bull channel behaves like a wedge, and traders think of it as a wedge variation.
I said that the 2-month rally was the 3rd leg up in a wedge bull channel. If you look closely, the rally also had 3 pushes up. It is therefore a small wedge. When a 2-month wedge is the 3rd leg up of a bigger wedge, there is a nested wedge. That is more climactic, and it has a higher probability of leading to a reversal. This week is a good candidate for the start of a reversal down.
However, if next week is a bull bar closing on its high, it would be a buy signal bar. Traders would expect a little more sideways to up trading before the test down to the November 4 low.
The 1st reversal down will probably be minor
A reversal does not mean a bear trend. That would be a major trend reversal. When a tight bull channel reverses, the reversal is typically minor. That means it has becomes a bull flag or a trading range.
When there is a reversal after a buy climax, traders want to see at least a couple legs down. They want to be sure that the reversal will not become major (a bear trend) before buying again. They like to see the bears try at least twice and fail. At that point, the bulls will look for a buy setup.
Two clear legs typically require about 10 bars, and often more. Therefore, the odds favor at least a month or two of sideways to down trading, and it might have begun this week. If the bears get a 3rd consecutive bear bar next week, especially if it closes near its low, traders will conclude that the pullback is underway.
In addition to looking for a couple legs down, traders expect a test of support. The most common support is the start of the final leg up. Traders want to seek if the bulls will buy again at that price. That is the November 4 low at around 1.16.
Expect a test of 1.25, but not in January
Can the bull channel continue up to the next resistance before the bulls take profits? Of course. A strong bull trend often goes much further than what appears likely.
The next resistance is the top of the bull channel that was created by the March 9 and September 1 highs. That is currently around 1.24.
A more important target is the February 2018 high, just above 1.25. This rally should get there this year, but it will probably pull back first.
S&P500 Emini futures
Yearly Emini Chart has big outside up bar
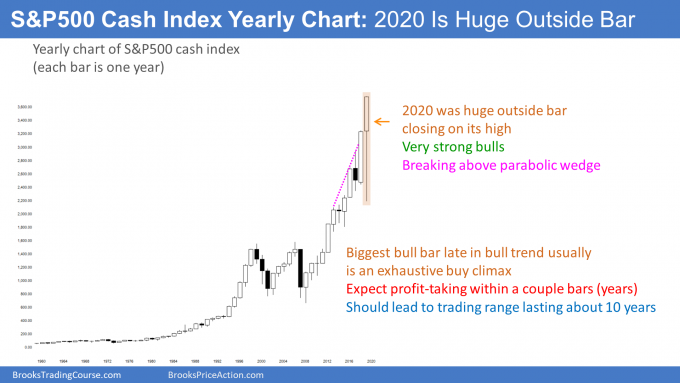
The yearly S&P500 Emini futures candlestick chart (each bar is one year) has a big outside up bar for 2020. I showed the cash index chart above because the Emini only goes back 24 years, but the two charts are almost identical since Emini began in 1997. This year closed on its high at a new all-time high, and far above last year’s high. This is a sign of very eager bulls, and it makes at least slightly higher prices likely in 2021.
The bulls hope that it is the start of a new, stronger leg up. But when an especially strong bull bar comes late in a bull trend, it often attracts profit takers within a couple bars (years). Therefore, it has an increased chance of being an exhaustive buy climax. That typically leads to about 10 bars and 2 legs of sideways to down trading. Consequently, while this is an extremely strong bull trend, it probably is getting too strong. It will probably lead to a decade-long trading range beginning within a year or two.
There was about a 10-year trading range after the 1965 buy climax, and again after the 2000 buy climax. Each had at least a couple pullbacks of 40 to 70%.
On the yearly chart, a 10-year sideways to down move of 50% is still just a pullback, because the stock market will continue to be in a bull trend on the yearly chart for at least another century. There is no sign of a top, and the Emini should go at least a little higher. However, this rally will probably lead to a prolonged trading range beginning within a couple years, like after 1965 and 2000.
Possible gap up on yearly chart
I have said many times over the past several weeks that the bulls would try to get the year to close on its high, and then create a gap up in 2021. The year closed on its high. There is a 50% chance of a gap up on Monday when 2021 begins.
If there is a gap up, it will be small on the yearly chart. A small gap is usually insignificant and it typically closes before the bar closes. But the yearly bar that starts on Monday closes a year from now. The Emini could rally a lot on the daily chart before closing the gap on the yearly chart.
What about the other 50%? Yes, a 50% chance of a gap up, but 50% chance of not a gap up. It is common to see an inside bar after a big outside bar. Therefore, rather than gapping up and creating a possible low of the year, the Emini could open below the 2020 high and create an early high of the year. There is a 20% chance of this happening.
If the Emini opens below this year’s high on Monday, it will probably break above the 2020 high within a couple weeks. Traders would expect it early next week.
Monthly Emini chart has follow-through buying after November strong breakout
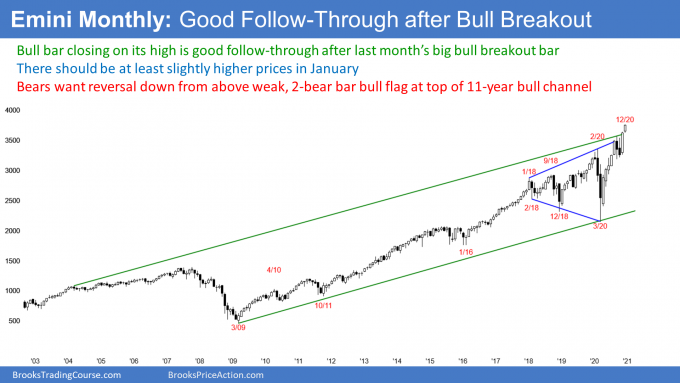
The monthly S&P500 Emini futures chart in December formed a bull bar closing near its high after a big bull breakout bar in November. This is strong follow-through buying, and it increases the chance of at least slightly higher prices in January.
As I have been saying for several weeks, the bulls want a gap up in January. That gap to a new all-time high would be present on the daily, weekly, monthly and yearly charts. While I have not checked, I suspect this has never happened in the history of the stock market. It would be a sign of aggressive buying.
If there is a gap up, the bulls will want it to stay open. However, the gap will probably be small on the monthly and yearly charts. Small gaps tend to be insignificant. Most close before the bar closes or shortly afterwards. That means a gap up on the monthly chart would likely close in January or February. If gap closes on the monthly chart, it will close on the yearly chart.
There is no sign of a top and this rally could continue much higher. Just look at 1995 to see how far a bull breakout can last.
However, there are some problems that could result in a pullback starting in January. A pullback does not mean a bear trend. For example, there was a 1-month pullback in September, and the bull trend resumed up in October. If January begins to pull back, traders will expect 1- 3 months of sideways to down trading.
The bears would need several strong down months before traders would wonder if a bear trend was beginning. That is currently unlikely.
Weekly S&P500 Emini futures chart in Small Pullback Bull Trend, but possible micro wedge and minor reversal down soon
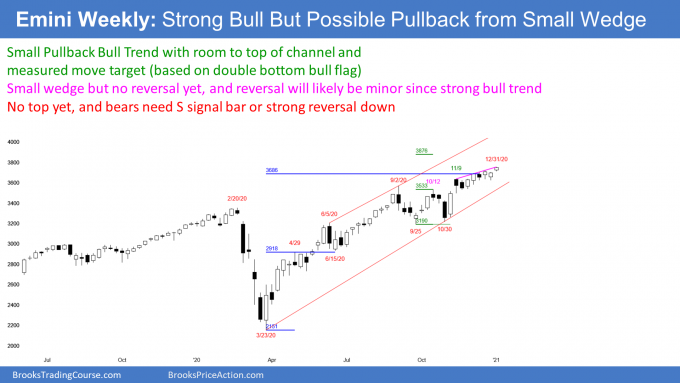
The weekly S&P500 Emini futures chart has rallied in a bull channel since the March low. It is now in the middle of the channel. Can the rally reach the top of the channel without a pullback to the October 12 high?
While it is possible, it is more likely that there will be a 2- to 3-week pullback beginning in January. The 1st support is that October 12 high, which is the neck line of the September/October double bottom bull flag. Markets often come back to test the breakout point before continuing up to the measured move target. That target is 3876.
With this week closing on its high, traders expect at least slightly higher prices for a week or two. But it is important to notice that about half of the bars for 4 months have had bear bodies. This means that the bears keep coming back, and that increases the chance of a pullback beginning in January.
What happens if the bulls keep getting bull bars closing on their highs? It would increase the chance that the rally will reach the top of the bull channel by some time in February. Bull trends can go a long way before pulling back, and there is no sign of even a minor top yet.
Daily S&P500 Emini futures chart in Small Pullback Bull Trend, but Late in Bull Channel
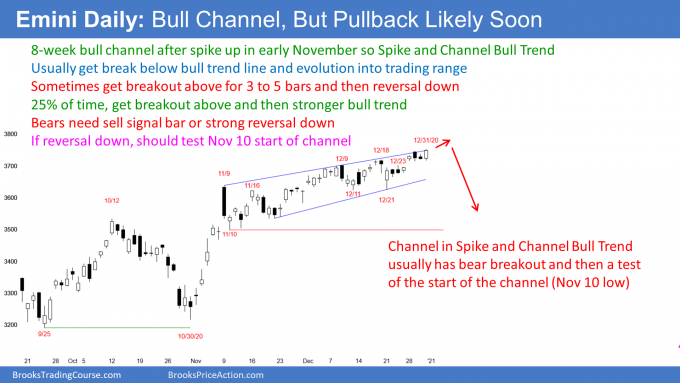
The daily S&P500 Emini futures chart had a strong rally in early November (a spike up), and then entered a bull channel with the pullback on November 10. This is a Spike and Channel Bull Trend.
The Emini has had several thrusts up in the channel, and it is now at the top of the bull channel. Traders should think of a bull channel as a bear flag. This is because there is a 75% chance of a break below the channel, and only a 25% chance of a successful breakout above the channel.
By successful, I mean restarting the market cycle. Instead of the channel evolving into a trading range, there would be a new breakout. That breakout would eventually have a pullback and then transition into a bull channel. After that, traders would again look for a break below the bottom of the channel (the bull trend line), and an evolution into a trading range.
Will the breakout above the bull channel fail?
The bulls began a small breakout above the bull channel this week. If the breakout is going to fail, it typically does so by around the 5th bar. There is often a very strong rally for several days before the bulls take profits and the buy climax reverses.
Traders will continue to buy until they see the reversal. Once it begins, the profit taking should last for a couple legs and about 10 bars.
Also, it should reach support. The most common target is the start of the bull channel. That is the November 10 low. Traders will wonder if the bulls will buy again there, like they did in November.
There is another reason for the Emini to test that level. It is also at the October 10 high, which is the neck line of the September/October double bottom that I mentioned in the section on the weekly chart. Finally, that is around the 3500 Big Round Number, which is a psychological magnet.
So, traders should expect higher prices and possibly a very strong rally above the bull channel for about a week. Then, look for a possible reversal down to below the channel on the daily chart. This is more likely than a continuation up to the top of the channel on the weekly chart.
Trading Room
Traders can see the end of the day bar-by-bar price action report by signing up for free at BrooksPriceAction.com. I talk about the detailed Emini price action real-time throughout the day in the BrooksPriceAction.com trading room. We offer a 2 day free trial.
Charts use Pacific Standard Time
When I mention time, it is USA Pacific Standard Time (the Emini day session opens at 6:30 am PST, and closes at 1:15 pm PST). You can read background information on the intraday market reports on the Market Update page.

