Al added a few comments to report
Market Overview: Weekend Market Analysis
The SP500 Emini futures reversed up strongly from the 50-day and 100-day moving averages and from just above the bottom of the bull channel on the daily chart. The odds favor a new all-time high around 4800 before end of the year. The rally might go higher still before there is another pullback.
The EURUSD Forex formed a 3rd consecutive doji bar on the weekly chart after an extreme sell climax. Traders should expect a rally for a couple months starting soon or after one more brief leg down.
EURUSD Forex market
The EURUSD weekly chart
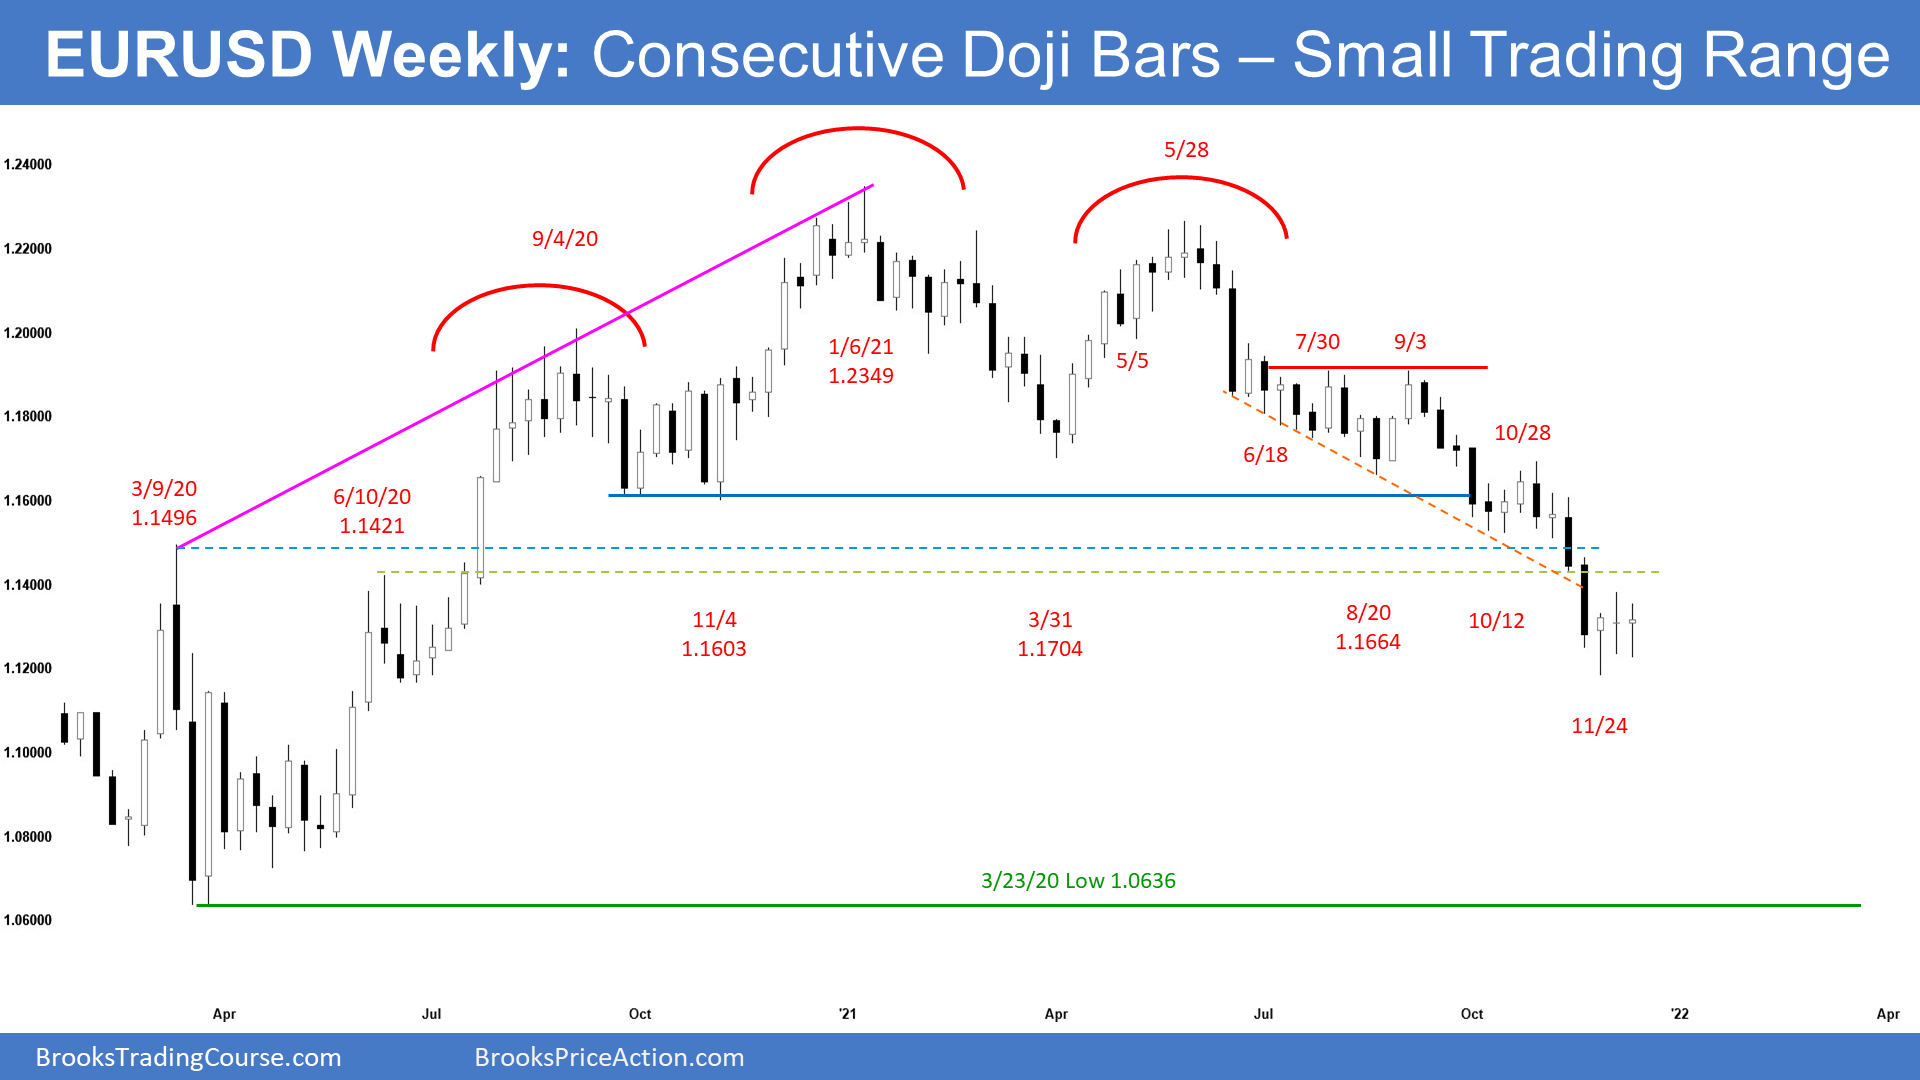
- This week’s candlestick on the weekly EURUSD Forex chart was a 3rd consecutive doji bar.
- This week triggered a Low 1 sell signal by going below last week’s low. Last week was a weak sell signal bar. Selling below a weak sell signal bar in a sell climax is a low-probability bet. This week was a bad entry bar.
- There is now a micro double bottom and a High 2 buy signal bar with the low of 2 weeks ago. While looking for a reversal in an extreme sell climax is reasonable, buying above a doji bar is a low-probability bet.
- The 3 dojis mean that the price is just about right. The bears are hoping this is a pause in the yearlong bear trend. And it is.
- The bulls are hoping it is a credible start of a 2-month rally. And it is.
- Traders need more information, which means more bars.
- if the bear trend resumes, the EURUSD will probably try to reverse again within a few weeks. Major reversals in currencies have an increased chance of happening around the start of the year. Look at this year’s selloff… it began in early January.
- Al has been saying for a few weeks that there should be a sideways to up move lasting at least a couple months starting from where the EURUSD is now or from slightly lower.
- The EURUSD is in the middle of a 7-year trading range. Legs rarely go straight from the top to the bottom without some confusion, which is a hallmark of a trading range.
- This year has been clearly bearish. Clarity does not last forever in trading ranges.
- The 2021 selloff is still more likely a pullback from the 2020 rally than a resumption of the bear trend that began 14 years ago.
- A couple of months of sideways to up trading is likely before there is a breakout below the bottom of the 7-year range, if there is going to be a breakout below the bottom before a breakout above the top.
- There is only a 30% chance that this selloff will continue down with only brief pullbacks and then break strongly below the 7-year trading range.
The EURUSD daily chart
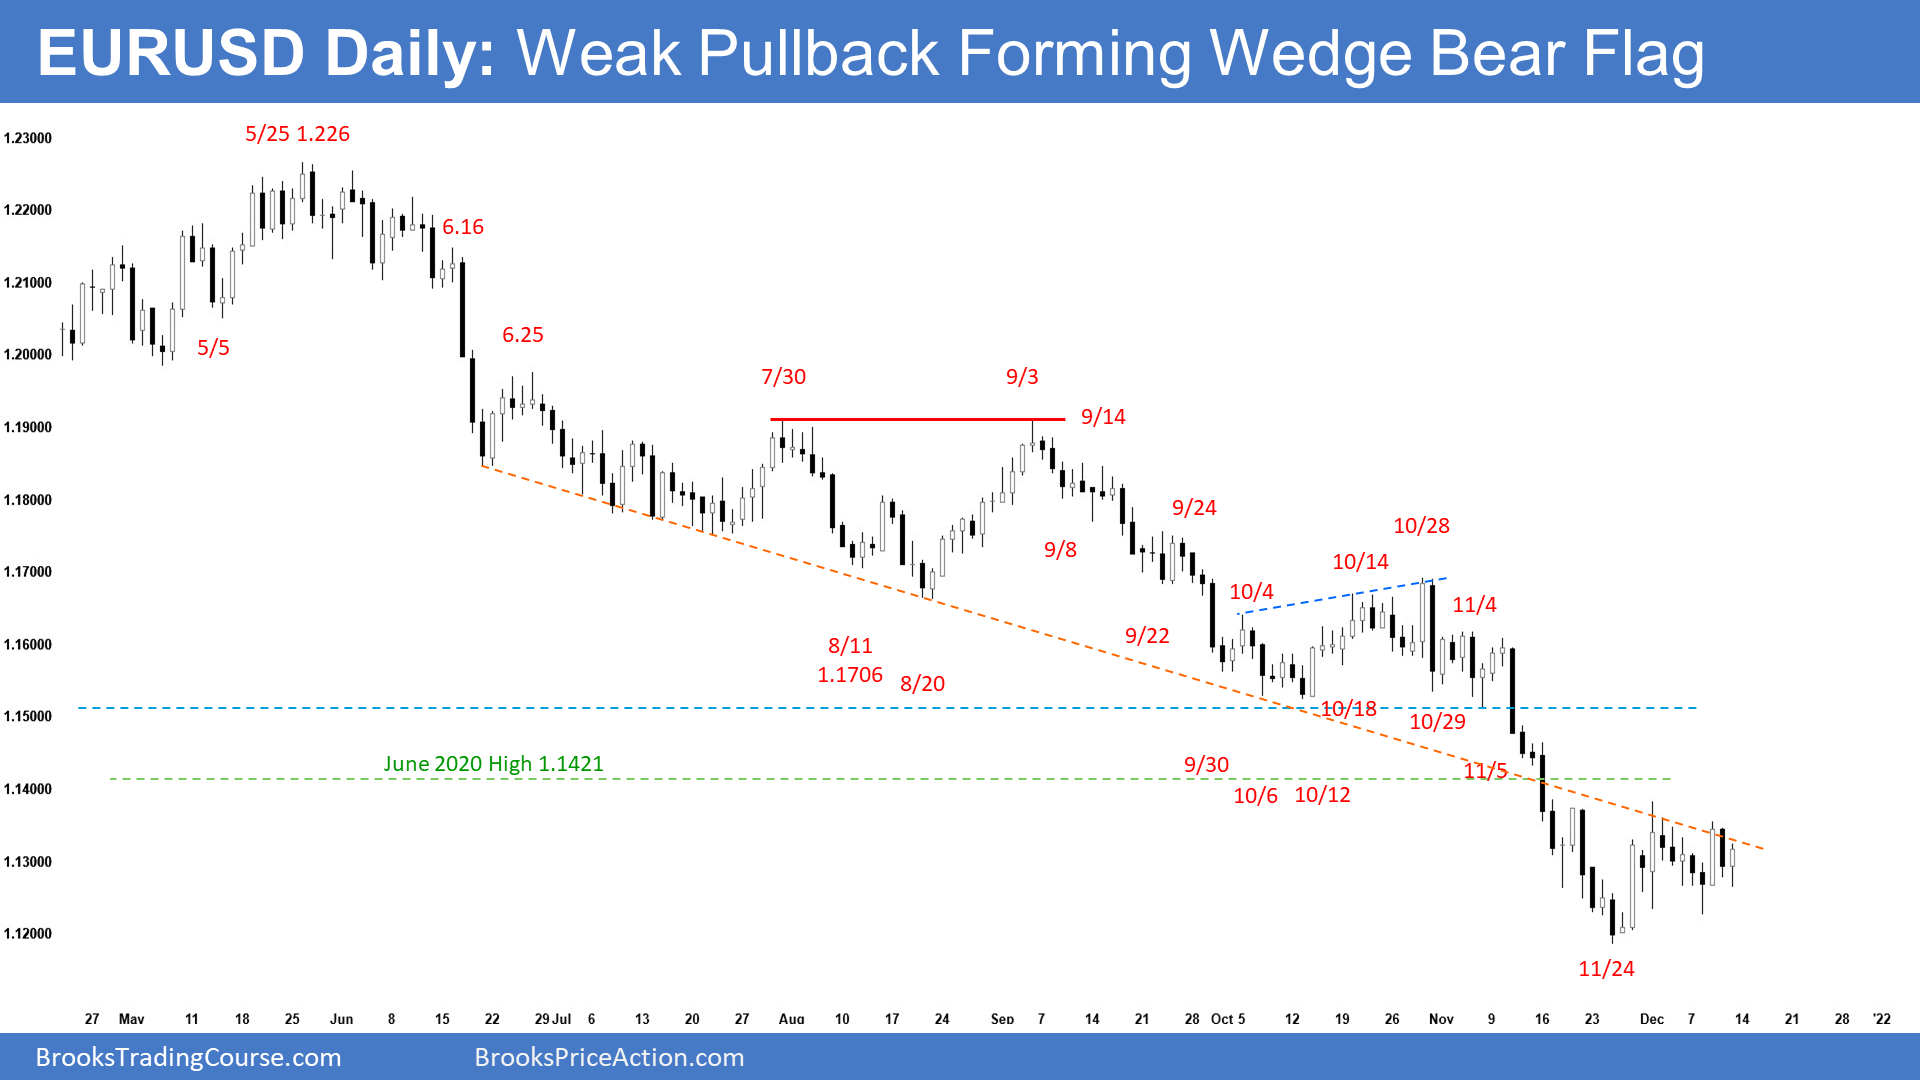
- The EURUSD has been in a small trading range for several weeks.
- Some computers will call it a triangle.
- The bears tried to get the bear trend to resume several times over the past couple weeks.
- If the market tries to do something several times and fails, it often then tries to do the opposite.
- A trading range is a Breakout Mode environment. There is a 50% chance of a bull breakout, a 50% chance of a bear breakout, and a 50% chance that the 1st breakout will fail.
- A triangle can be a reversal pattern.
- A triangle late in a bear trend usually becomes the final bear flag.
- Consequently, if there is a bear breakout, it will probably reverse up. It might reach a measured move down first.
- No matter what happens over the next several weeks, traders should expect sideways to up trading lasting at least a couple months, starting before the EURUSD goes much lower.
- The November collapse was a breakout below the bear channel. There is a 75% chance that a breakout below a bear channel will reversal at least back to the middle of the channel. It can do that by going sideway or up. It is currently going sideways. If it starts to go up, the 1st target is the most recent lower high, which came on October 28.
- Al has been saying that because the EURUSD has been in a trading range for 7 years, the odds of more reversals are greater than those of a breakout of the 7-year range.
- The current leg down has lasted a year. While it could last longer, it will probably reverse up for at least a couple of months before breaking below last year’s low and the 2017 low at the bottom of the 7-year range.
S&P500 Emini futures
The Monthly Emini chart
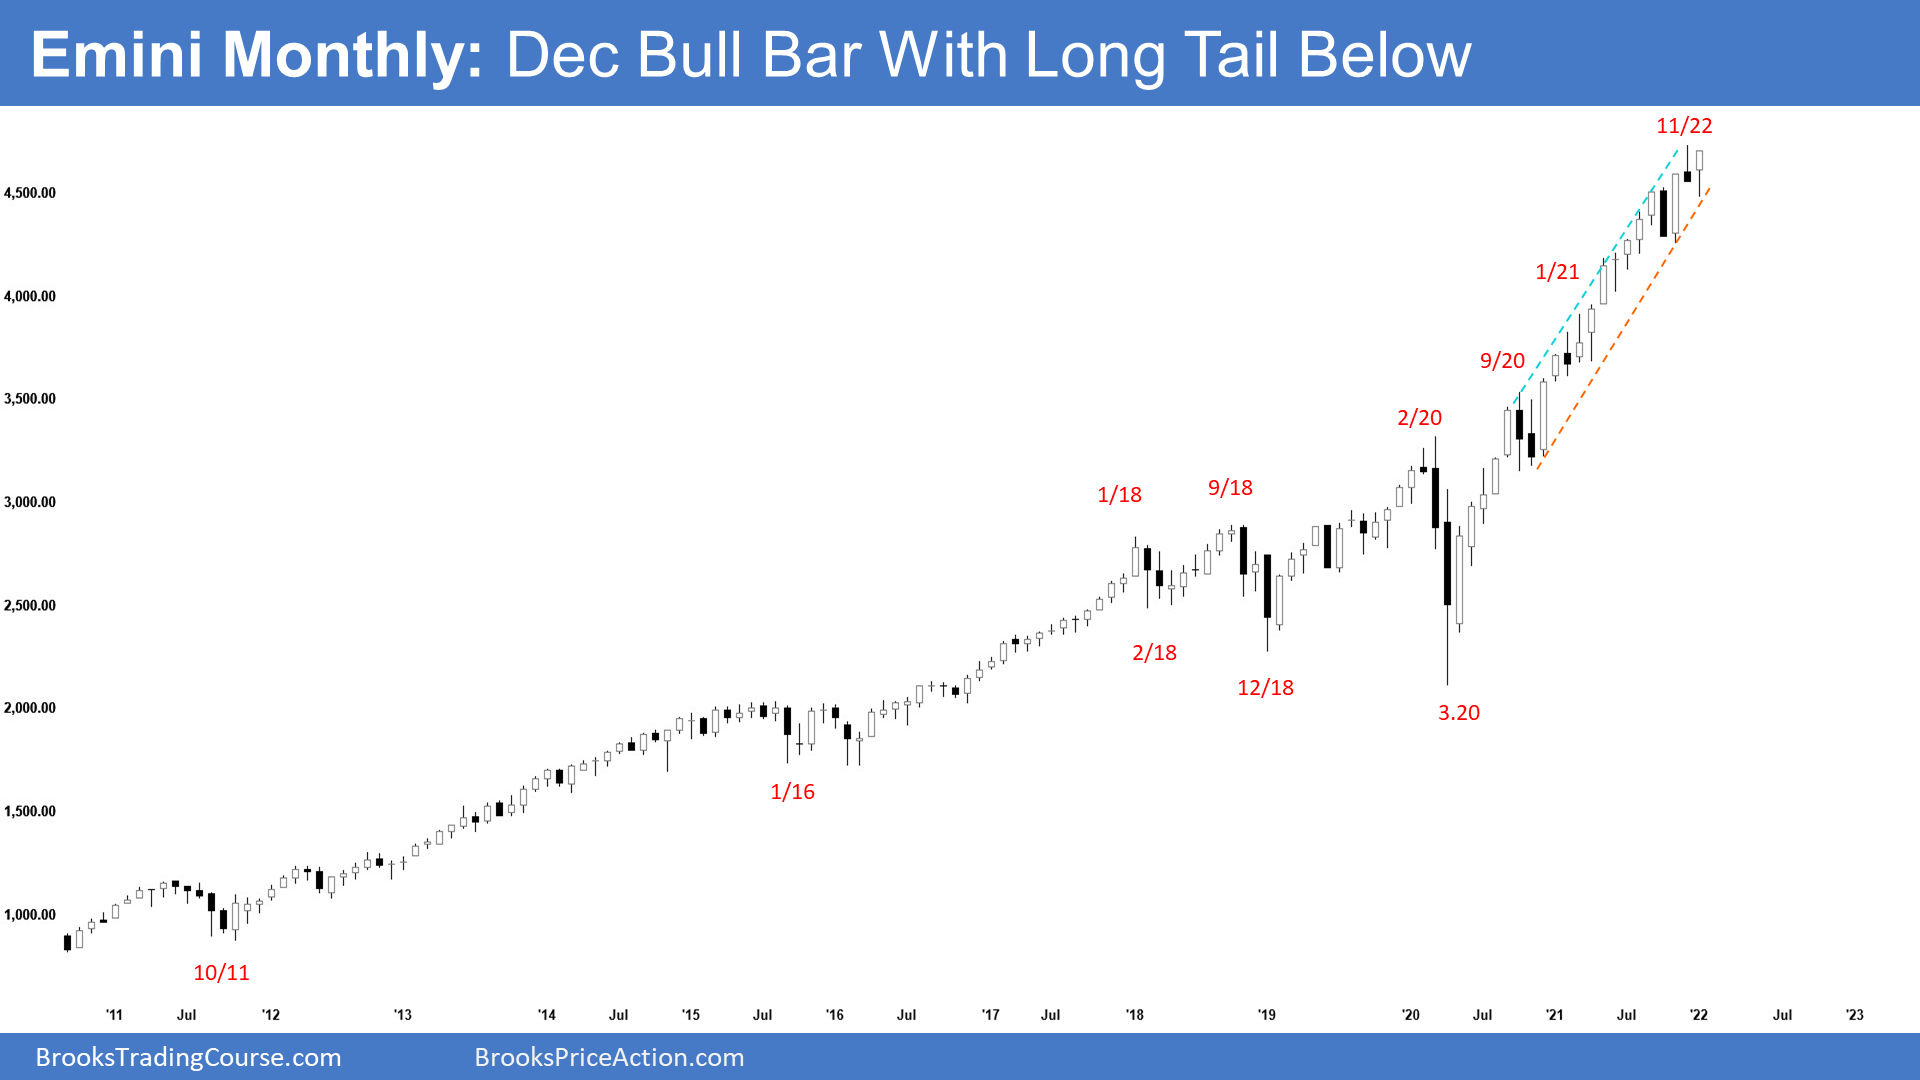
- The Emini triggered a monthly sell signal when December traded below the November low.
- However, December so far is a big bull bar closing near its high. If it continues to stay above the November high, the sell signal will have failed. Additionally, the outside up bar would be a buy signal. Odds favor new all-time high around 4800.
- At the moment, December will probably go above the November high and form an outside up candlestick. That will make higher prices likely in January.
- The 1st trading day in 2022 is a Monday. If December closes near the high, which is likely, January might gap up above the December high. There would then be a gap up on the daily, weekly, monthly, and yearly charts. I do not know if that has ever happened.
- If January made a new high and there was a reversal down in January or February, there would be a micro wedge top. That would probably lead to a couple bars (months) of sideways to down trading.
- There were consecutive outside bars in September and October. November triggered an OO buy signal. December triggered a sell signal for a failed OO bull flag.
- The bull trend is now resuming in December. There will be another buy signal if December breaks above the November sell signal bar high, which should happen before the end of the month.
- While the bull trend has been surprisingly strong, it is too strong. The Emini typically does not double every 21 months. It averages about 8% a year.
- If it is up over 100% in 2 years, for it to get back to an 8% average, it will need many years with less than an 8% gain.
- While a bull trend can last a long time (look back at 1995), it will transition into a trading range (look at 2000). Traders should expect at least a couple sideways years staring within the next couple of years.
- The trading range after 2000 lasted 10 years. There were selloffs of 50 and 70%.
- After the strong bull trend in the 1960s, the stock market also went sideways for about a decade. During that time, there were 2 selloffs of at least 40%.
- That is our future. While the Baby Boomers are very happy today, within a few years, they will be eating peanut butter instead of steak.
- Al has said that because the bull trend is so strong, November was a minor sell signal. That means the best the bears can probably get is 2 or 3 sideways to down bars to maybe a little below the October low. That will still be true if there is a micro wedge top in January or February.
- But a 2-month selloff could be the beginning of a trading range that could last a year or more. For example, the Emini went sideways for 2 years after the January 2018 buy climax.
- Therefore, while the Emini might make a new high in December or early in 2022, it probably will not last long. There is better than a 50% chance of at least a couple of months sideways to down trading beginning within the next few months. It might have already begun.
- While December will probably close at a new all-time high and it might break above 4800, it is still early in the month. There is plenty of time for a bear surprise, causing the monthly bar to look very different by the end of the month.
The Weekly S&P500 Emini futures chart
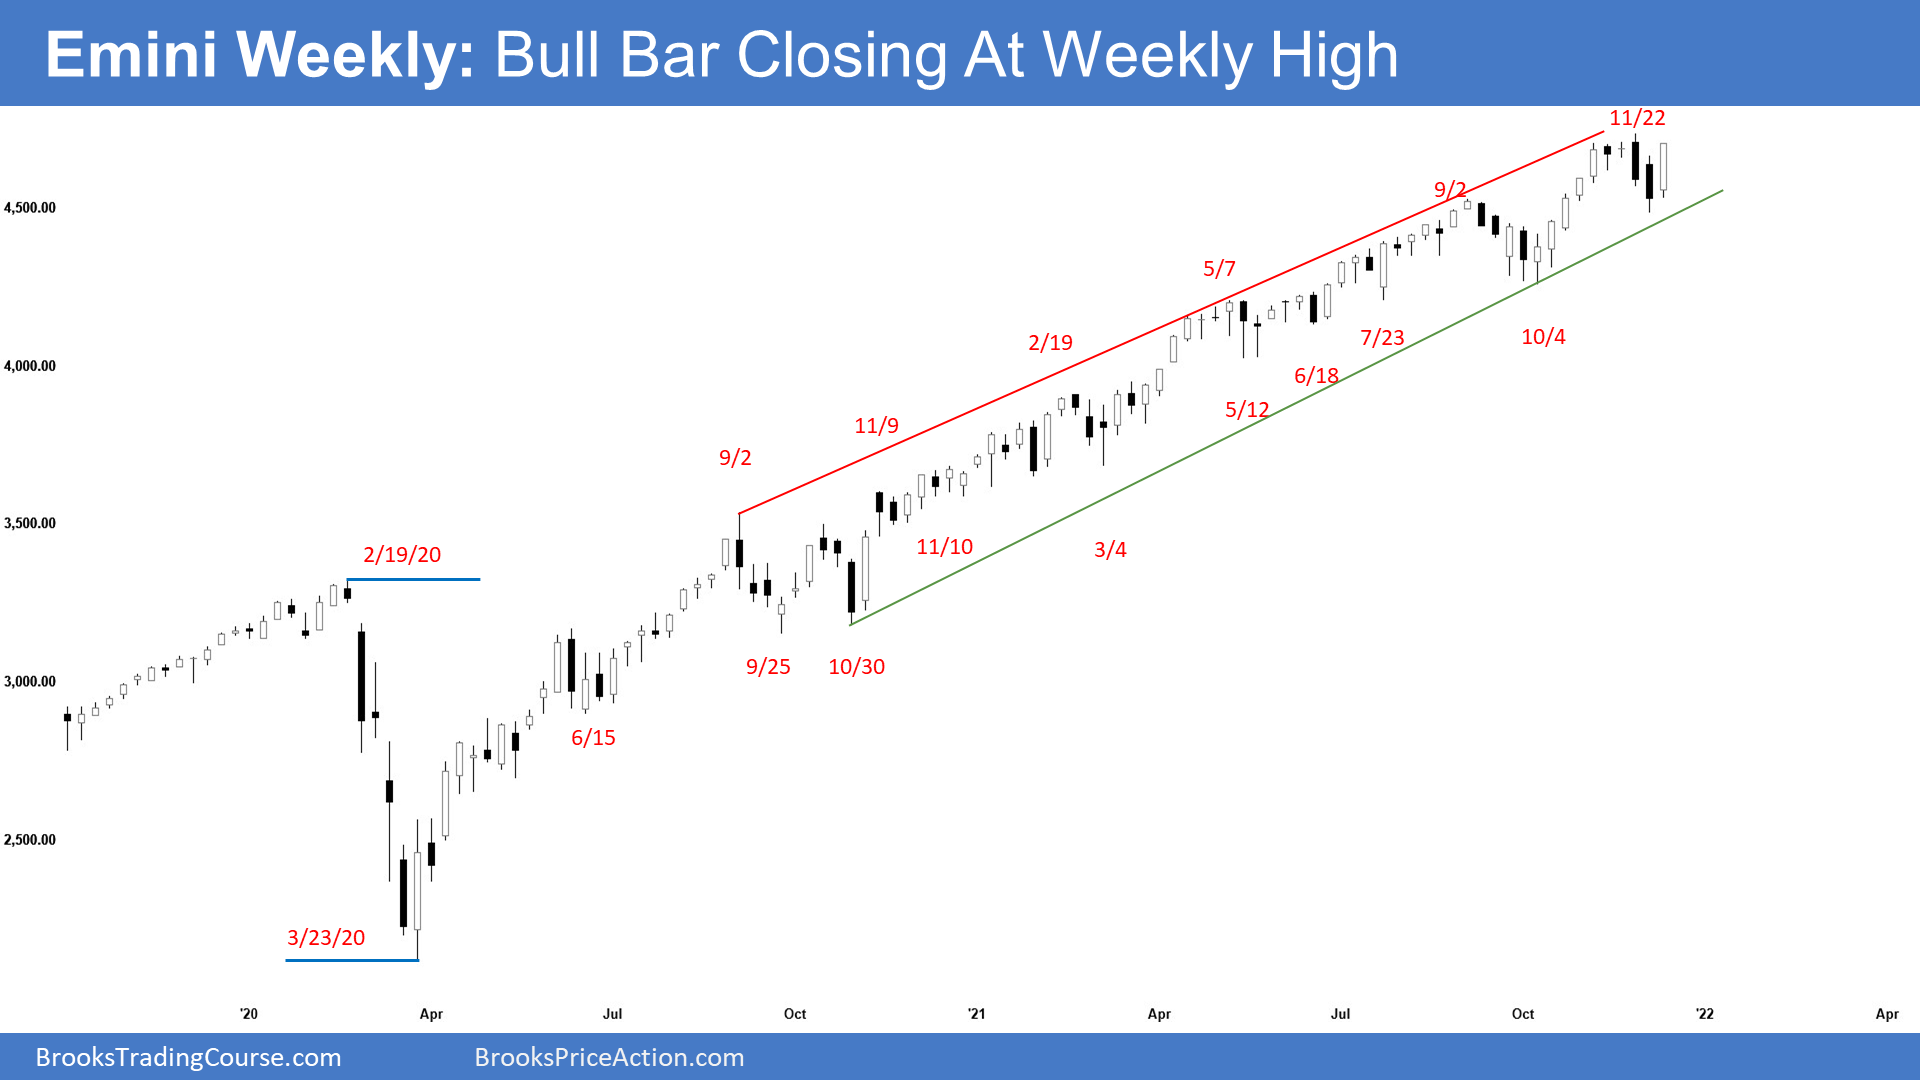
- This week’s Emini weekly candlestick was a surprisingly big bull bar closing near its high.
- We have said that a strong reversal back up can come at any moment because the Emini is still in a Small Pullback Trend.
- Since this week was big bull bar closing near its high, the probability of a new high by the end of the year is back to 60%.
- The next target for the bulls is the top of the trend channel line around 4850. The round numbers of 4800 and 4900, and 5000 are all magnets above.
- The bears want a double top major trend reversal with November high, even if December goes slightly above it.
- If there is a reversal from above the November high, it would be from a wedge top (September 2, November 22) at the top of the bull channel. That would make traders look for a couple legs down to the most recent higher low, which is the low from 2 weeks ago. The target below that is the prior higher low, which is the October low at the start of the 2nd leg up.
- The weekly chart triggered a High 1 bull flag buy signal when this week went above last week’s high. Since this week closed near its high, it is a good buy signal bar for next week. Monday may gap up on the weekly chart.
- However, last week was a bear bar and there were consecutive bear bars. That is a weak High 1 buy signal and it reduces the chance of the Emini going far above last week’s high without another pullback.
- Al has said that the Emini has been in a strong bull trend since the pandemic crash. There have been a few times when the bears got the probability of a correction up to 50%, but never more. The probability of higher prices has been between 50 and 60% during this entire bull trend. It has never been below 50%. That continues to be true.
- The strong selloffs, like in September in 2020 and again in 2021, pushed the probability for the bears up to 50%. But every prior reversal has failed, and the bears never had better than a 50% chance of a trend reversal.
- Odds favor at least slightly higher prices next week.
The Daily S&P500 Emini futures chart
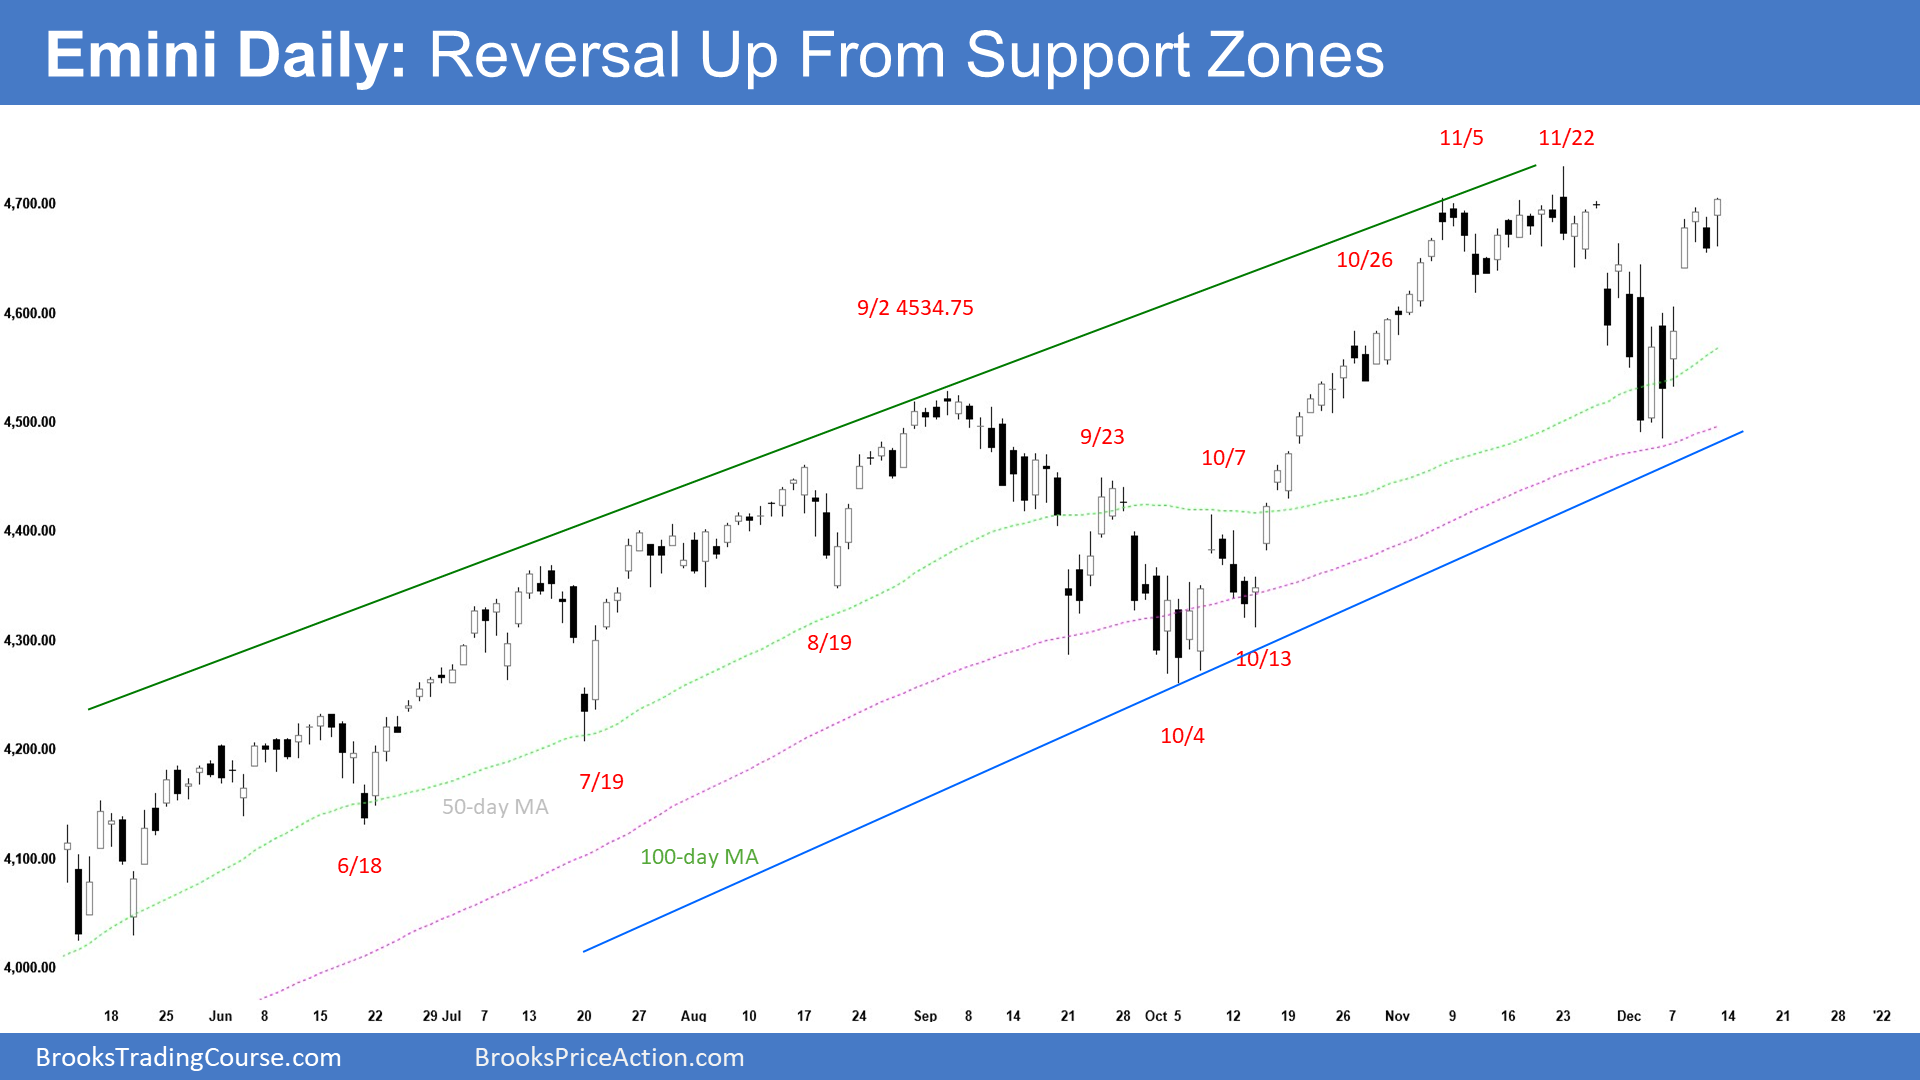
- The Emini is having a strong rally from a pullback to the 50-day and 100-day moving averages and from just above the bottom of the bull channel
- With Friday closing near its high, there is an increased chance of a gap up on Monday.
- The bulls want a strong break above the November high and a test the top of the bull channel around 4840 area. The bears want a double top or a wedge top.
- If the Emini breaks above the November high, there would be a failed double top. The bulls would look for a measured move up, which would be around the big round number of 5000.
- Al said that the bulls are trying to get December to go above November’s high, and it probably will. December would then be an outside up month, which would increase the chances of higher prices in January.
- But if there is a new high and then a reversal, there would be a wedge top on the daily chart (and a micro wedge on the monthly chart).
- If the Emini reverses down from around the November high, there would be a double top.
- Either reversal could lead to a pullback for a few weeks, and possibly a trading range for several months.
- If there is a reversal, the 1st target would be the most recent major higher low, which is the December low. If the Emini were to fall below that, traders would look for a measured move down to the October low. That would also be about a 10% correction.
- Which is more likely? The odds for the bulls have always been 50% or greater. This is especially true if the bulls get strong follow-through buying next week.
- However, if the bulls fail to get strong follow-through buying and the bears manage to form a few big bear bars closing near their lows, the odds of a pullback from a major trend reversal would increase.
- At the moment, the odds favor a new high and a break above 4800 before the end of the year. There is only a 40% chance of a strong reversal down in the next few weeks, and only a 30% chance of a strong break below the December low before there is a new high.
Trading Room
Traders can see the end of the day bar-by-bar price action report by signing up for free at BrooksPriceAction.com. I talk about the detailed Emini price action real-time throughout the day in the BrooksPriceAction.com trading room. We offer a 2 day free trial.
Weekly Reports Archive
You can access all weekly reports on the Market Analysis page.

