Market Overview: DAX 40 Futures
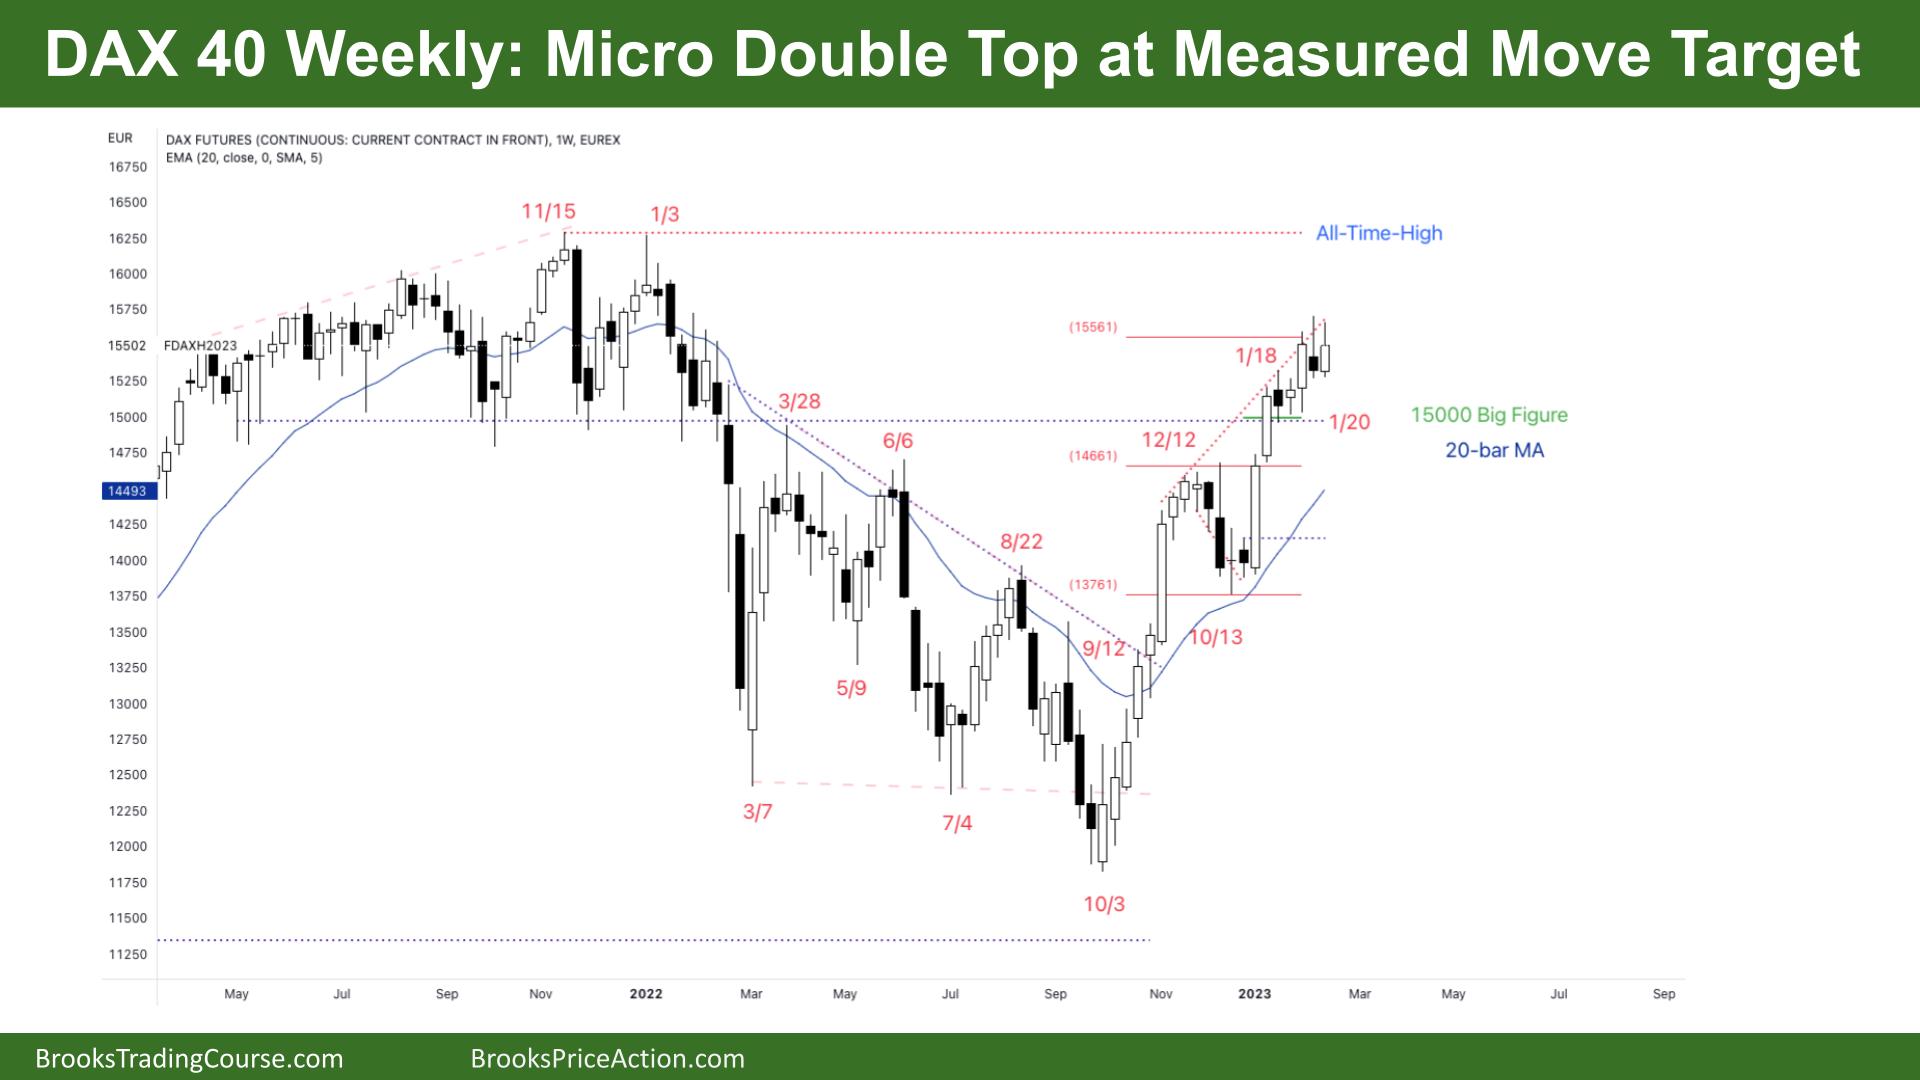
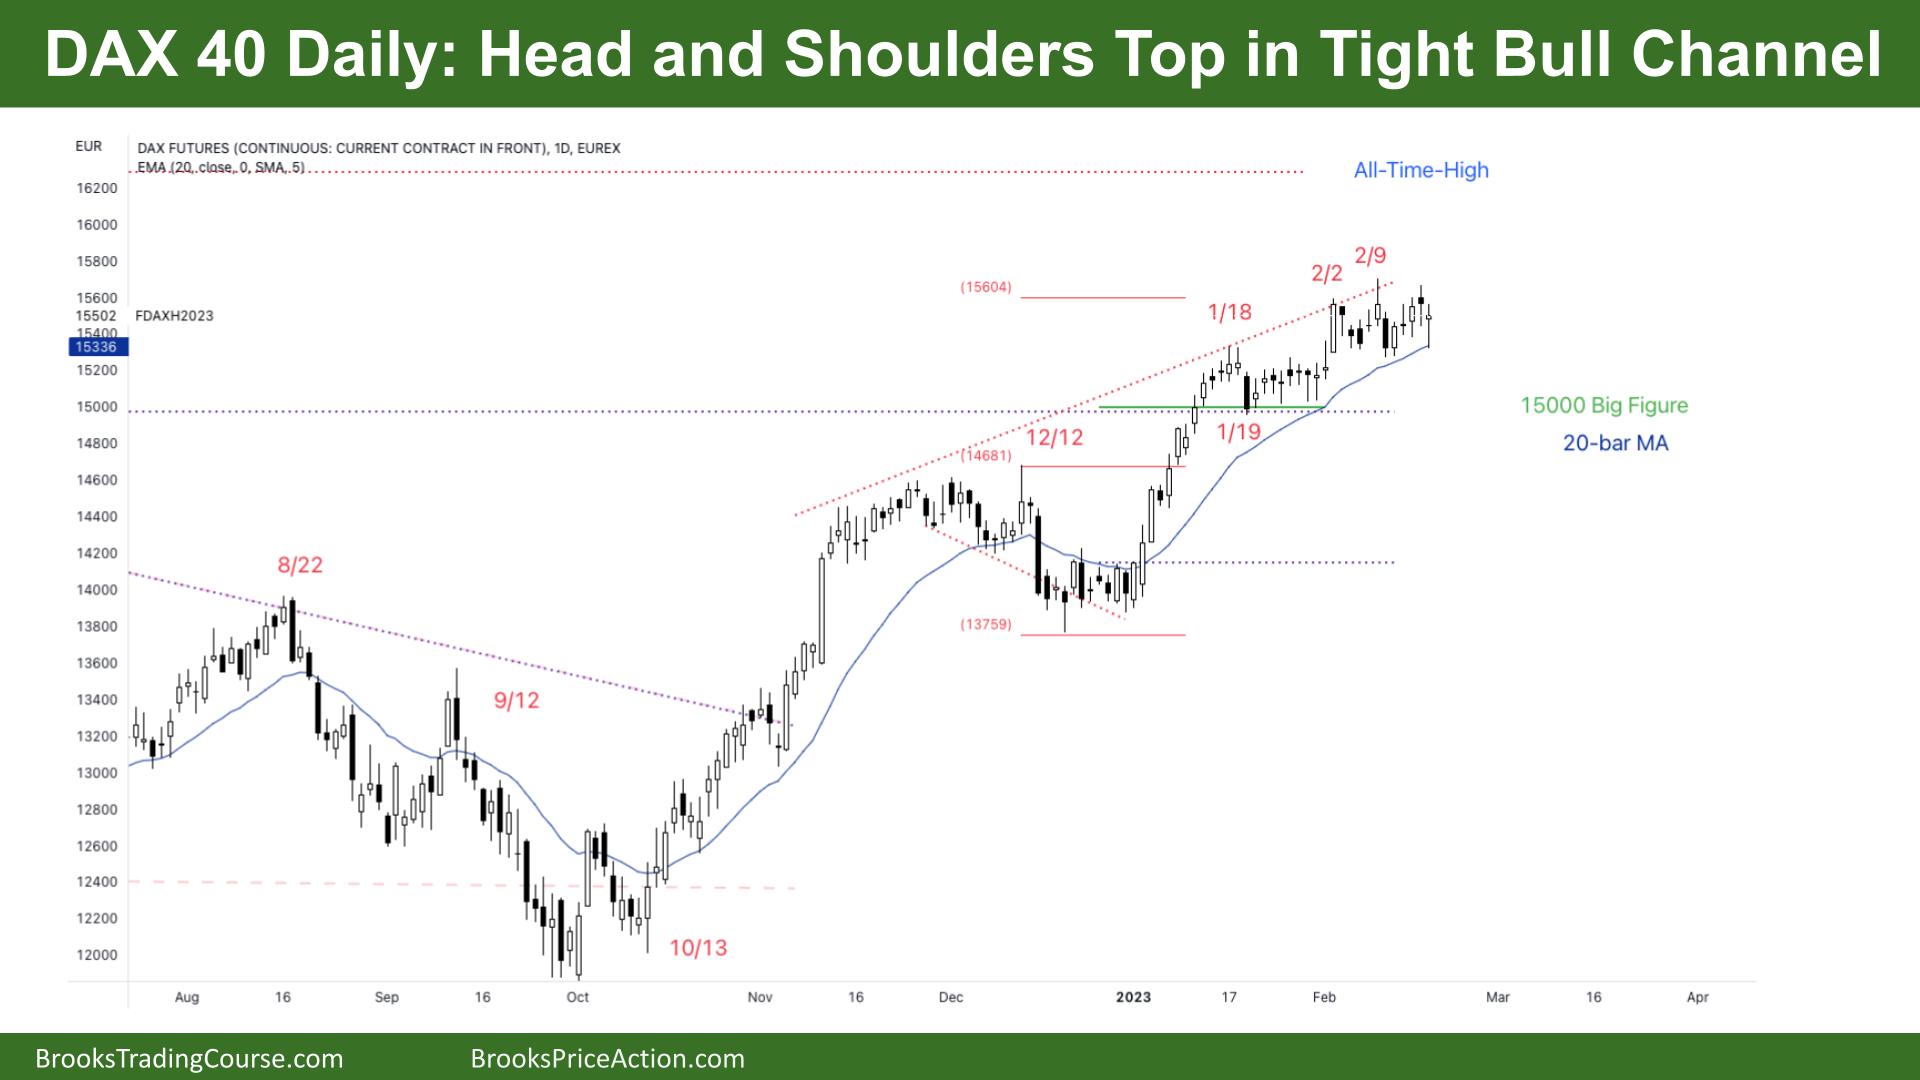
DAX 40 micro double top at a measured move target. It’s a tight bull channel that is slowing down, and we might need to go sideways for profit-taking next week. The daily chart is forming a possible head and shoulders top, which could signal a two-legged pullback. The lack of consecutive bear bars might also get a buy climax up as bears give up to the next resistance area.
DAX 40 Futures
The Weekly DAX chart

- DAX 40 micro double top at a measured move target.
- Last week it was a small bull inside bar with tails above and below, closing on its mid-point.
- For the bears, it’s a micro double top and a sideways bar coming late in the bull trend.
- The bulls see a tight bull channel, and three pushes up, but the second leg was so strong they probably expected a little more up.
- The bears see a possible final flag and are looking to short at the next signal. But it’s a bull bar. There are currently no sell signals.
- We never traded below the bear bar two weeks ago, so most traders should be long or flat. A micro double top is a weak reversal signal.
- The bulls want three pushes up and a break above a wedge top for a measured move up. But they’ll need consecutive bull bars closing on their highs, closing above the last two weeks. They know they probably won’t get it.
- As the bars have been going sideways and trends tend to weaken over time, the bears want an outside down bar, so it’s an ioi, a reversal pattern for a wedge top short back towards the moving average.
- We are still high above the prior breakout points and the moving average and large gaps below, so next week should be sideways to up.
The Daily DAX chart

- The DAX 40 futures on Friday was a small bear doji with its low at the moving average.
- The bulls see we’re going sideways after a break above a bull flag and a test of the moving average.
- They’d like consecutive bull bars closing above last week’s high and a follow-through bar to confirm a breakout and another move higher.
- The bears see a possible head and shoulders top with Feb 2nd and 9th.
- The bears see the last two weeks as a possible final flag, and any push higher is likely to be a bull trap and be met with profit-taking.
- But there are no sell signals. Most traders can see how many days have been doji’s in the past few weeks, which is a lack of direction.
- Instead of the price going down to the moving average, the price is going sideways, and the moving average is coming up. So it’s a lack of speed and a lack of acceleration.
- Most traders are going to expect more sideways price action for the bulls.
- The bulls have their stop far away, so they’re more likely to take profits.
- If the bears get consecutive bear bars, they might get a two-legged correction to the moving average and prior breakout points.
- But the bears know the best they can get is a trading range, probably back to the last bear bar closing on its low on the 20th of January.
- So if we get down there, the bulls will probably see that as a double bottom bull flag and an opportunity to go long for a swing up and a measured move above the highs.
- Most traders should not be trading the daily chart when there are 15 to 20 doji bars.
- If you are trading, it’s better to be long or flat. Most traders will exit below a decent bear bar.
Market analysis reports archive
You can access all weekend reports on the Market Analysis page.

