Monthly S&P500 Emini futures candlestick chart:
2017 stock, bond, and Forex market predictions
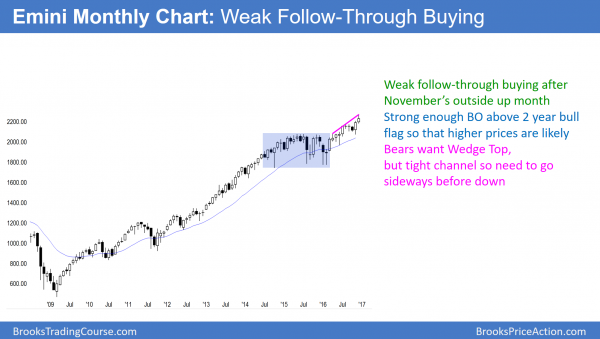
The monthly S&P500 Emini futures candlestick chart had a bull trend bar this month. Yet, it had a big tail on top and the month closed in the middle. While the bull body confirms last month’s bull breakout, the bulls are disappointed.
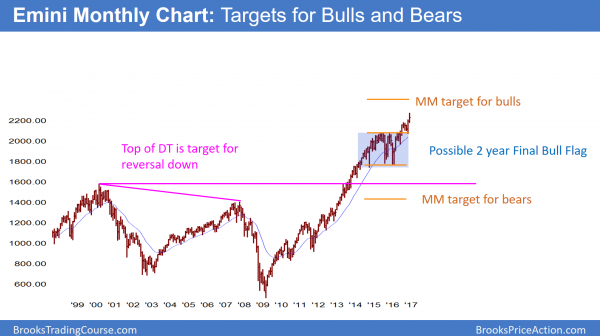
The monthly S&P500 Emini futures candlestick chart has targets above and below.
The monthly S&P500 Emini futures candlestick chart has been in a strong bull trend since the February low. Because it has had 3 pushes up in a tight channel, the bears hope this is a parabolic buy climax. While possible, the deep pullbacks after the 1st 2 legs up reduced the climactic nature of the rally. Hence, a parabolic wedge top is not likely. Since the channel is tight, the first reversal down will probably be minor. It would therefore likely create a small bull flag rather than a bear trend.
In addition to the good momentum up, there are several measured move targets around 2350. These are magnets that increase the chance for at least a little more rally.
There is a gap below this month’s low and the August high. Because the gap is late in a bull trend, the odds are that it will close before the Emini gets to its targets above. Yet, the bulls will probably buy the reversal. They therefore would be correctly betting that the probability favors a breakout test more than a reversal down.
The next 4 years
What will Trump do? I don’t care. All I care about is the chart. The monthly chart is in a bull trend. Yet, it went sideways for about 20 bars before the July bull breakout. Therefore, the current breakout might lead to a Final Bull Flag reversal down. Because there is no sign of a top, the bears will probably need at least several sideways months to create at least a micro double top.
Since there is a potential Final Flag below, it is a magnet once there is a reversal down. Hence, the reversal will probably trade down to the bottom of the flag, which is around 1800. Furthermore, the March, 2000 and the October, 2007 highs formed a double top. Since the breakout above those highs has never been tested, the odds are the Emini will fall to around 1500 to test those highs at some point in the next several years. That is also a measured move down below the 2015 – 2016 trading range source top10forex.net.
Weekly S&P500 Emini futures candlestick chart:
Failed breakout above the August high
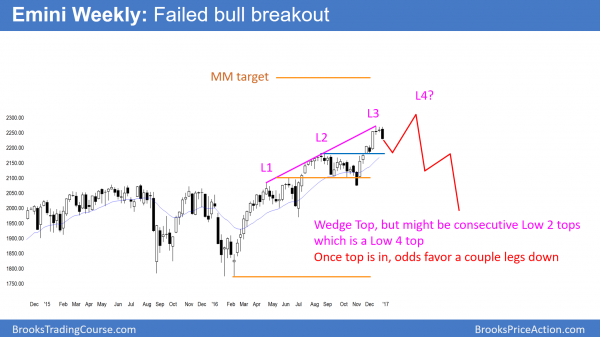
The weekly S&P500 Emini futures candlestick chart created a strong bear bar this week. Since the prior 2 weeks were dojis after a buy climax, this week has an increased chance of leading to at least slightly lower prices. Because the Emini has not tested the breakout above the August high, traders are wondering if this is the start of the test.
The Emini broke strongly above a Low 2 top attempt. That increases the chances of a 2nd leg up after the November breakout. If there is another leg up and then a reversal down, that would create consecutive Low 2 tops. Hence, that would be a Low 4 top. Therefore, traders would look for a couple legs down.
The weekly S&P500 Emini futures candlestick chart sold off this week. Since this was after the Dow repeatedly failing to break above the 20,000 Big Round Number, it might trade a little lower. Yet, the weekly chart was in an 8 bar bull micro channel until this week’s reversal. The bulls therefore have been strong. As a result, this reversal is more likely minor than the start of a bear trend. A minor reversal is either the start of a bull flag or a trading range. While it is possible that a minor reversal setup like this can lead to a major reversal down, that is unlikely.
In addition, the Dow is still close enough to 20,000 to still be within its gravitational field. Therefore, the odds are that it will get above 20,000 in the next few weeks.
Daily S&P500 Emini futures candlestick chart:
Pullback to the moving average
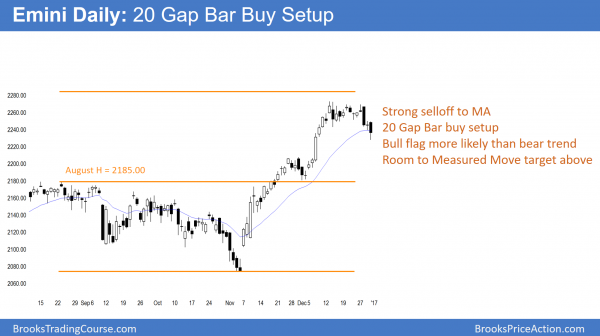
The daily S&P500 Emini futures candlestick chart pulled back to the moving average after being above it for about 40 bars. While the selloff has been strong, this is a 20 Gap Bar buy setup, and the odds are that the downside is small.
The daily S&P500 Emini futures candlestick chart sold off this week. Yet, the bulls have been willing to buy above the moving average for 2 months. Since they now get a chance to buy at an average price instead of above average, many will. As a result, the downside over the next week is probably limited.
Sometimes the selloff to the moving average after a 20 Gap Bar buy setup can be strong. The Emini can therefore break strongly below the average. Yet, scale in bulls usually are able to either make a profit or avoid a loss.
Start of a stock market correction?
Because this selloff is following an extreme buy climax, it has an increased chance of being the start of a bear trend. In addition, the Emini will probably test the August high breakout point at some time in the next few months. Is this the start of that test? Probably not. Despite the strong rejection of Dow 20,000, the odds at the moment still favor another rally before reaching the August high.
For traders to believe that the high is in, the bears will need either a major trend reversal or a stronger reversal down. A major trend reversal is always a type of double top. Therefore, the bears will need at least one more rally to test the December high. Less likely, the current selloff can continue down relentlessly and accelerate. While unlikely, if there is a series of bear trend bars next week, traders will believe that the Emini has begun its test of the August high.
Bond market top for the next 20 years
I began trading in 1987. At the time, I noticed that the bond market was falling. I was confused because the stock market was rallying while the bond market was creating a great, low risk alternative in the form of CDs. Eventually, traders saw that the high risk stock market was too dangerous, and the market repriced down 25% in one day in October, 1987.
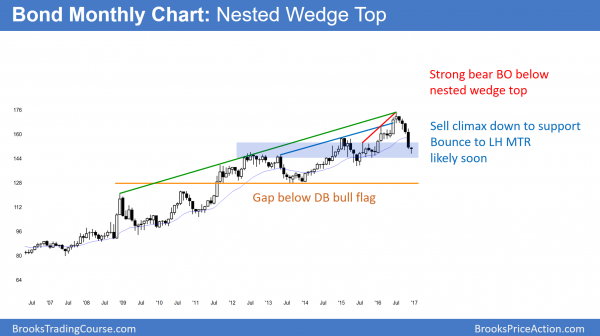
The monthly chart of the 30 year bond market had a strong bear breakout after nested wedge tops. While the sell climax will probably lead to a rally over the next couple of months, the odds favor a lower high major trend reversal and a bear trend.
The bond market has rallied strongly for the past 30 years. Yet, its monthly chart has nested wedge tops. In addition, there has been a big bear breakout. Wedge tops that reverse down strongly typically have at least one more leg down. How far down will it go? Every prior higher low in the bull trend is a target. Especially relevant is the gap below the August 2013 low. In addition, that low formed a double bottom bull flag with the March 2012 low, around 125. That is therefore an obvious magnet over the next few years.
Like 1987, higher interest rates on CDs provide a low risk alternative to stocks. As a result, money will probably begin to shift from stocks to CDs. Hence, the stock market will probably reprice down as interest rates rise.
While the bond selloff has been climactic and a significant bounce is likely, the odds favor a top. Hence, the rally will probably form a lower high major trend reversal on the monthly chart.
EURUSD Forex market: Test of par in 2017
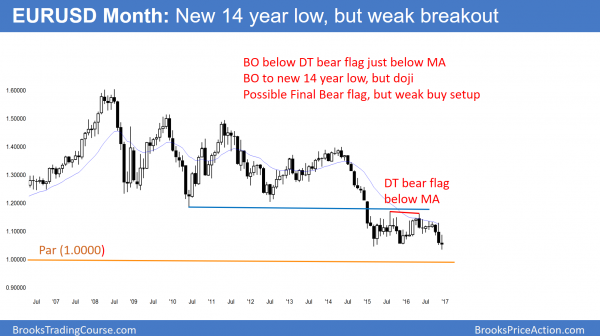
The monthly EURUSD Forex chart broke below a double top bear flag that was below the moving average. While it has not yet broken strongly below the low of the flag, the odds are that it will fall for a measured move down to around par (1.0000)
The monthly EURUSD chart has been in a bear trend since 2008. After a 6 year trading range, it broke strongly to the downside in 2014. It formed a double top bear flag in 2015. After going sideways until it hit the moving average, it broke to the downside. That pattern was therefore a Low 2 sell setup at the moving average.
This month’s breakout below the bear flag is also a new 14 year low. Yet, the month was a doji candlestick pattern instead of a strong bear bar. While this is not a strong breakout, it is not a good buy setup either. A measured move down based on the height of the year long trading range is far below par (1.0000).
While the weekly chart is trying to bounce, the odds are that the monthly chart will reach par in 2017. It is a strong psychological magnet, the momentum down is strong, and it is now nearby.
Final Bear Flag?
Whenever a bear flag forms late in a bear trend, there is an increased chance that it will be the Final Bear Flag. Therefore traders watch to see if the bear breakout reverses back up. While the year long trading range might in fact be the Final Bear Flag, there is no sign of a bull reversal. Furthermore, there is still room down to the important magnet of par.
January reversal up?
Over the past 20 years, there have been about 10 major reversals on the monthly chart. Three have come in January. Traders know that there is an increased chance of a major reversal in January. Yet, the probability is still low. Because of this tendency, traders will be more willing to buy if there is a strong reversal up in January. Since there is no clear reversal yet, the odds still favor lower prices.
Traders can see the end of the day bar-by-bar price action report by signing up for free at BrooksPriceAction.com. I talk about the detailed Emini price action real-time throughout the day in the BrooksPriceAction.com trading room. We offer a 2 day free trial.
When I mention time, it is USA Pacific Standard Time (the Emini day session opens at 6:30 am PST, and closes at 1:15 pm PST). You can read background information on the intraday market reports on the Intraday Market Update page.
